 Permanecer
Condiciones de negociación
Products
Herramientas


On Tuesday, the euro declined by 42 pips. The downward movement paused at the 55-day moving average (MA55). Now, the test of the target support at 1.1495 — if the market decides to react to new guidance from the FOMC — is likely to occur via a sharp breakout, as it would need to overcome technical supports. If that happens, the next target would be 1.1380.
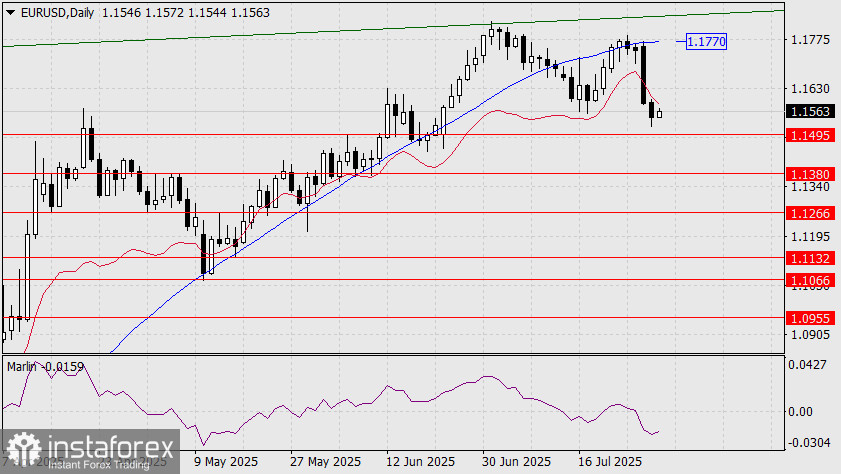
The current situation on the daily chart is bearish: the price is holding below the indicator lines, the MACD line has turned downward, and the Marlin oscillator is declining in the negative zone.
The only question is: how strong will the FOMC signal be regarding a possible rate cut in September? We believe it won't be particularly strong — possibly just one rate cut before the end of the year, without further changes in December.
This is due to inflation, which has started to rise again. Additionally, we observe the Federal Reserve's resistance to market-driven signals for rate cuts, particularly in relation to the yield curve. The FOMC is pursuing a deeper, more strategic agenda.
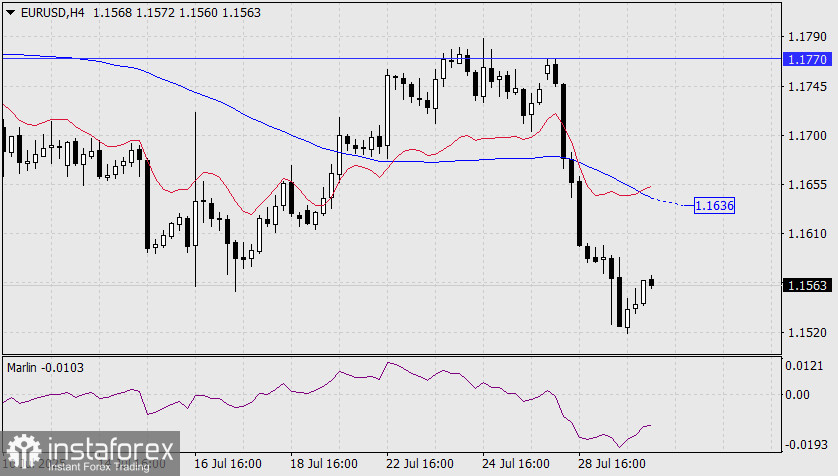
On the H4 chart, the picture is also fully bearish: the price is declining below downward-sloping indicator lines, and the Marlin oscillator has made a mild correction — a release of pressure to allow for a smoother continuation of the decline.
However, if the price breaks above the MACD line (1.1636), an attack on the daily MACD line at 1.1770 becomes possible. But that would be an alternative scenario.
¡Los informes analíticos de InstaForex lo mantendrá bien informado de las tendencias del mercado! Al ser un cliente de InstaForex, se le proporciona una gran cantidad de servicios gratuitos para una operación eficiente.


