 Permanecer
Condiciones de negociación
Products
Herramientas


Trend Analysis
In August, the price from the level of 1.1414 (closing of the July monthly candle) may begin to move upward toward the target of 1.1710 – historical resistance level (blue dashed line). From this level, a corrective downward movement may follow, targeting 1.1588 – the 14.6% retracement level (yellow dashed line).
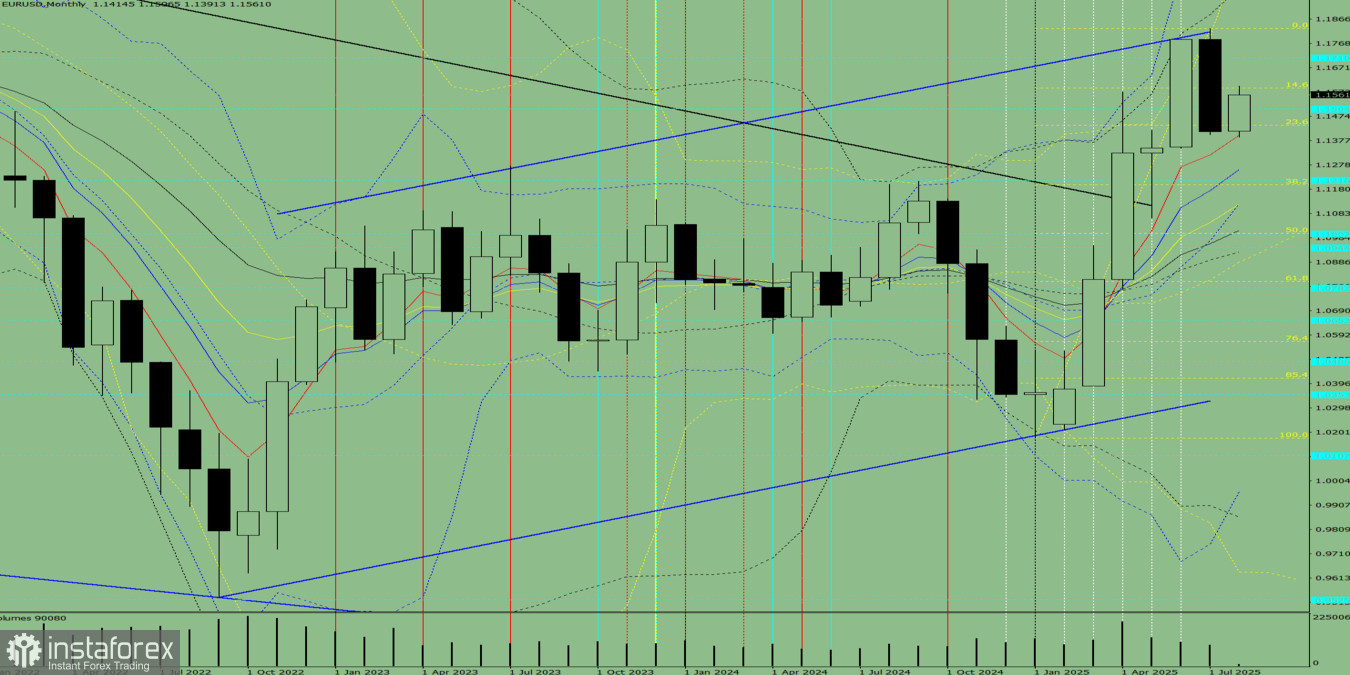
Fig. 1 (Monthly Chart)
Indicator Analysis:
Conclusion based on comprehensive analysis: a possible upward trend.
General forecast for the EUR/USD monthly candle: The price is likely to follow an upward trend, with no lower shadow on the monthly white candle (first week of the month – bullish) and the presence of an upper shadow (last week of the month – bearish).
Alternative Scenario: From the level of 1.1414 (closing of the July monthly candle), the price may begin an upward movement toward the target of 1.1829 – upper fractal (yellow dashed line). From that level, a downward move toward 1.1710 – historical resistance level (blue dashed line) is possible.
¡Los informes analíticos de InstaForex lo mantendrá bien informado de las tendencias del mercado! Al ser un cliente de InstaForex, se le proporciona una gran cantidad de servicios gratuitos para una operación eficiente.


