 Permanecer
Condiciones de negociación
Products
Herramientas


On Tuesday, the EUR/USD currency pair traded higher for a completely logical reason. The US Consumer Price Index showed a very unexpected figure — namely, 2.7%, matching the previous month's value. Thus, it is easy to conclude that inflation did not accelerate in July and overall is growing relatively slowly, much to Donald Trump's satisfaction. We believe that over the next six to twelve months, the CPI will continue to rise, but the question now is how much it will increase and how long it will remain high. Recall that the higher the inflation, the lower the likelihood of the Federal Reserve cutting rates in the foreseeable future. The new Fed Chair will likely follow Donald Trump's directives, and in 2026, we will almost certainly see a significant easing of monetary policy. However, 2026 is still far off, and in 2025, everything will depend on the labor market and inflation. Both of these indicators raise many questions, especially after Trump dismissed Erica McEntarfer from her post as Commissioner of the US Bureau of Labor Statistics.
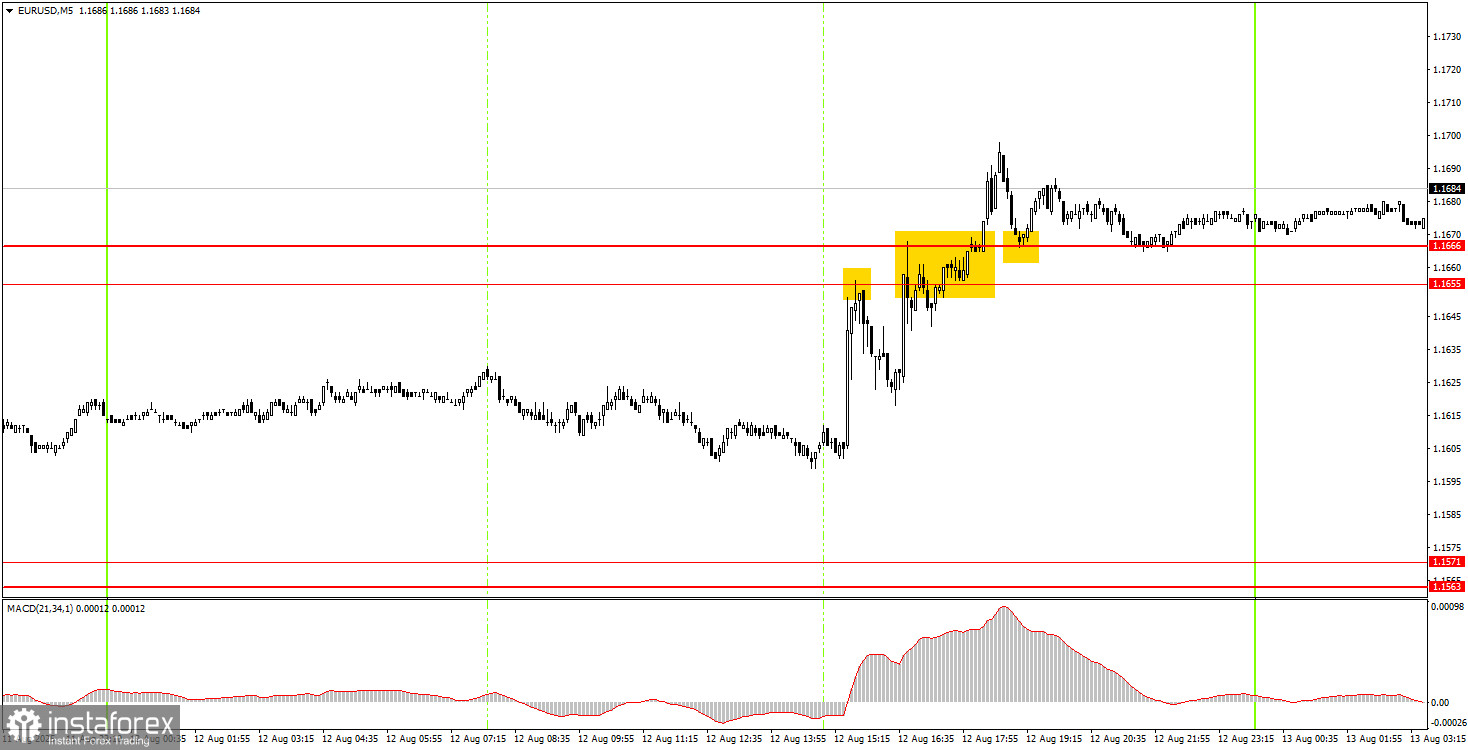
On the 5-minute timeframe, three trading signals formed on Tuesday. Unfortunately, all of them appeared either during the release of the US inflation report or immediately after it. Therefore, it was possible to safely trade any of these signals, as in each case the price moved at least 20 pips in the desired direction. However, the risks were high, and no profit was achieved because the movement stalled each time.
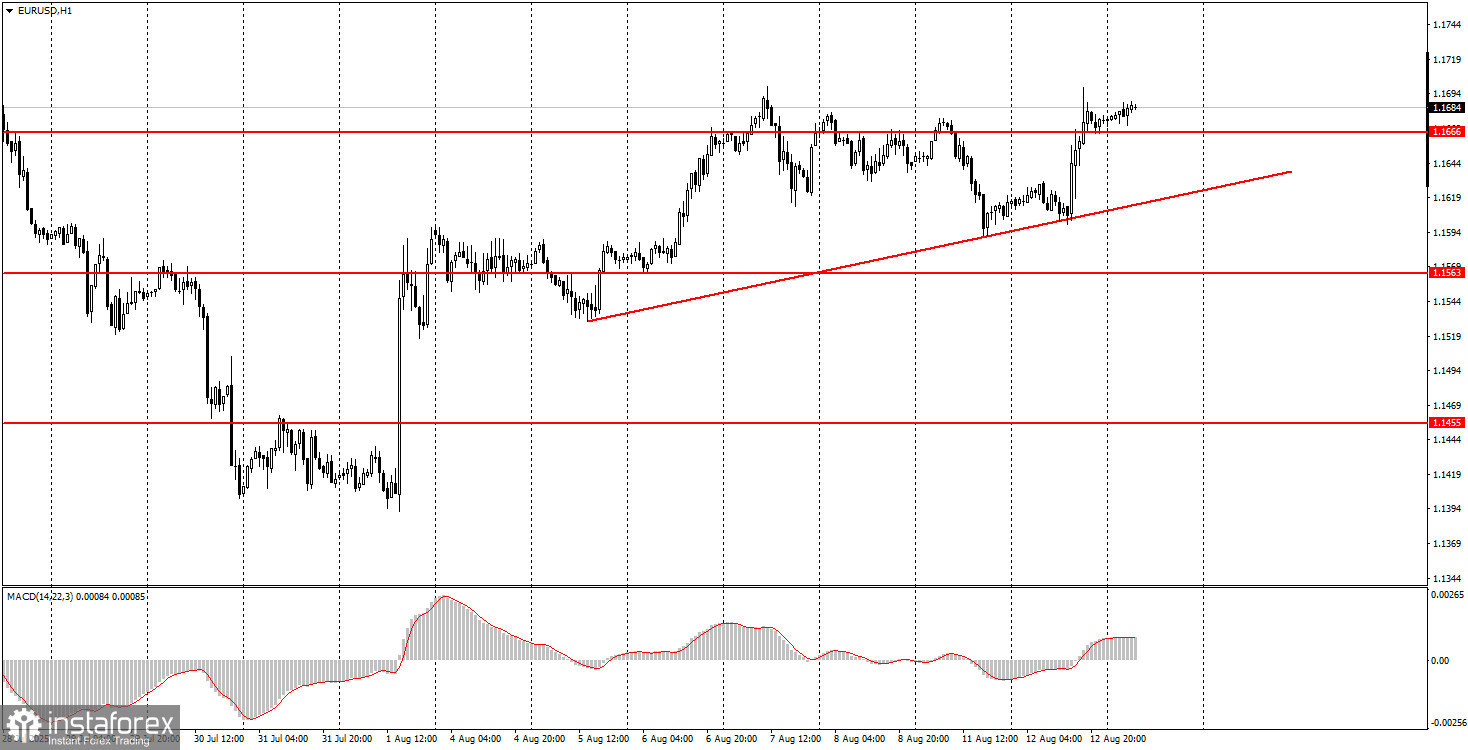
On the hourly timeframe, the EUR/USD pair has every chance to continue the uptrend that has been developing since the start of this year. The "house of cards" for the US dollar collapsed on the Friday before last, and since then, the situation for the dollar has continued to worsen. We had previously warned that there were no long-term grounds for growth in the US currency and had questioned the "optimism" associated with Trump's policies and their economic results. The latest data confirmed that the problems are indeed present.
On Wednesday, EUR/USD may continue its upward movement as it has broken through the 1.1655–1.1666 area and has bounced off it twice from above. Thus, long positions will remain relevant today. Shorts can be considered if the price consolidates below this area.
On the 5-minute timeframe, the following levels should be considered: 1.1198–1.1218, 1.1267–1.1292, 1.1354–1.1363, 1.1413, 1.1455–1.1474, 1.1527, 1.1552–1.1563–1.1571, 1.1655–1.1666, 1.1740–1.1745, 1.1808, 1.1851, 1.1908. No significant events are scheduled in the Eurozone or the US for Wednesday, and markets are already eagerly awaiting Friday, when the leaders of the US and Russia will meet in Alaska.
Support and Resistance Levels: These are target levels for opening or closing positions and can also serve as points for placing Take Profit orders.
Red Lines: Channels or trendlines indicating the current trend and the preferred direction for trading.
MACD Indicator (14,22,3): A histogram and signal line used as a supplementary source of trading signals.
Important Events and Reports: Found in the economic calendar, these can heavily influence price movements. Exercise caution or exit the market during their release to avoid sharp reversals.
Forex trading beginners should remember that not every trade will be profitable. Developing a clear strategy and practicing proper money management are essential for long-term trading success.
¡Los informes analíticos de InstaForex lo mantendrá bien informado de las tendencias del mercado! Al ser un cliente de InstaForex, se le proporciona una gran cantidad de servicios gratuitos para una operación eficiente.


