 Permanecer
Condiciones de negociación
Products
Herramientas


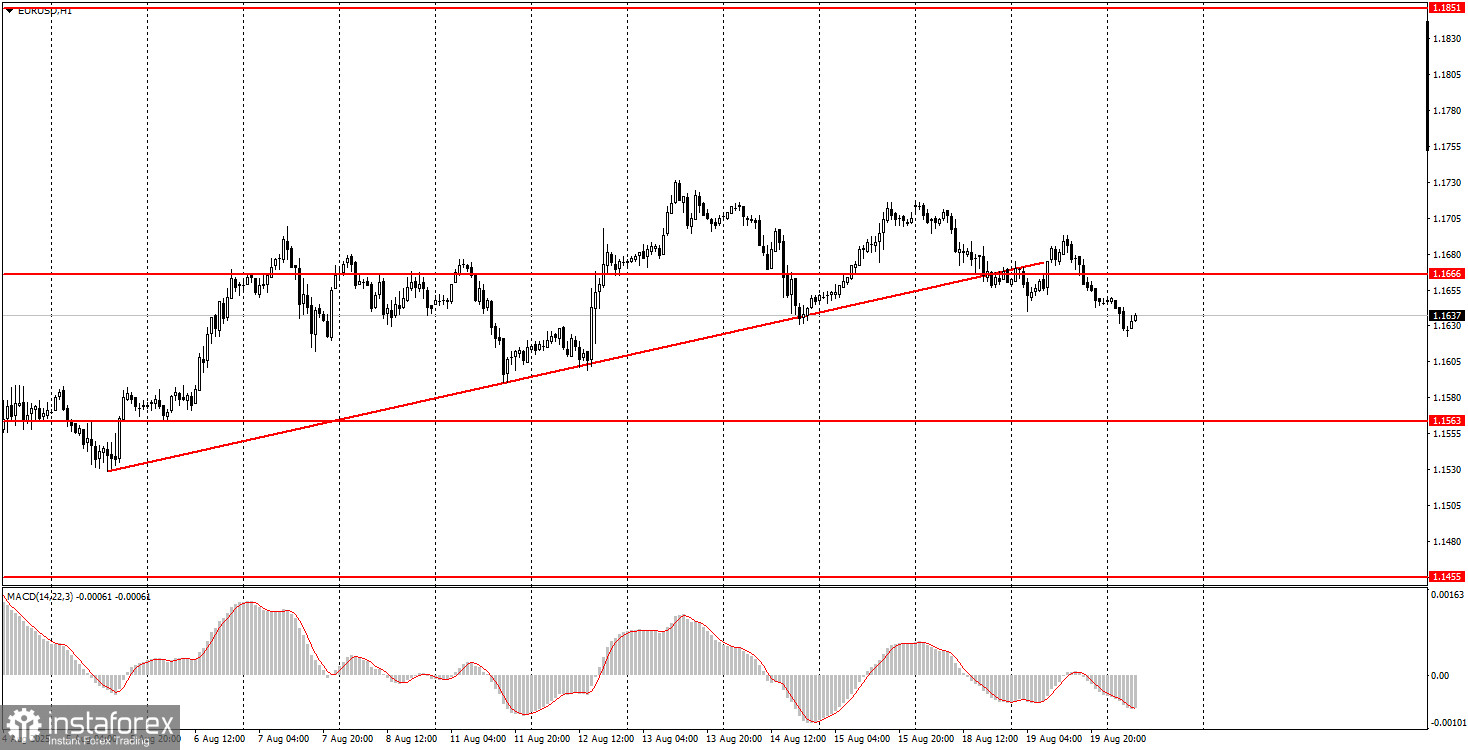
On Tuesday, the EUR/USD pair traded intraday in both directions with minimal volatility. The macroeconomic and fundamental background remains absent, leaving the market with nothing to react to. Yesterday, several reports from the U.S. construction sector were released, but as expected, they failed to trigger any trader response. Thus, we are currently observing a movement close to flat. We continue to believe that the latest upward trend has not been canceled, despite the break of the trendline. In our view, the flat phase is merely a pause in the market, and we see no reason to consider the upward trend as complete. Of course, this does not mean the price cannot decline in the coming days. On Friday, Jerome Powell is scheduled to speak, and no one knows what message the Federal Reserve Chair will deliver to the markets. His rhetoric may remain unchanged, which could support U.S. dollar buyers.
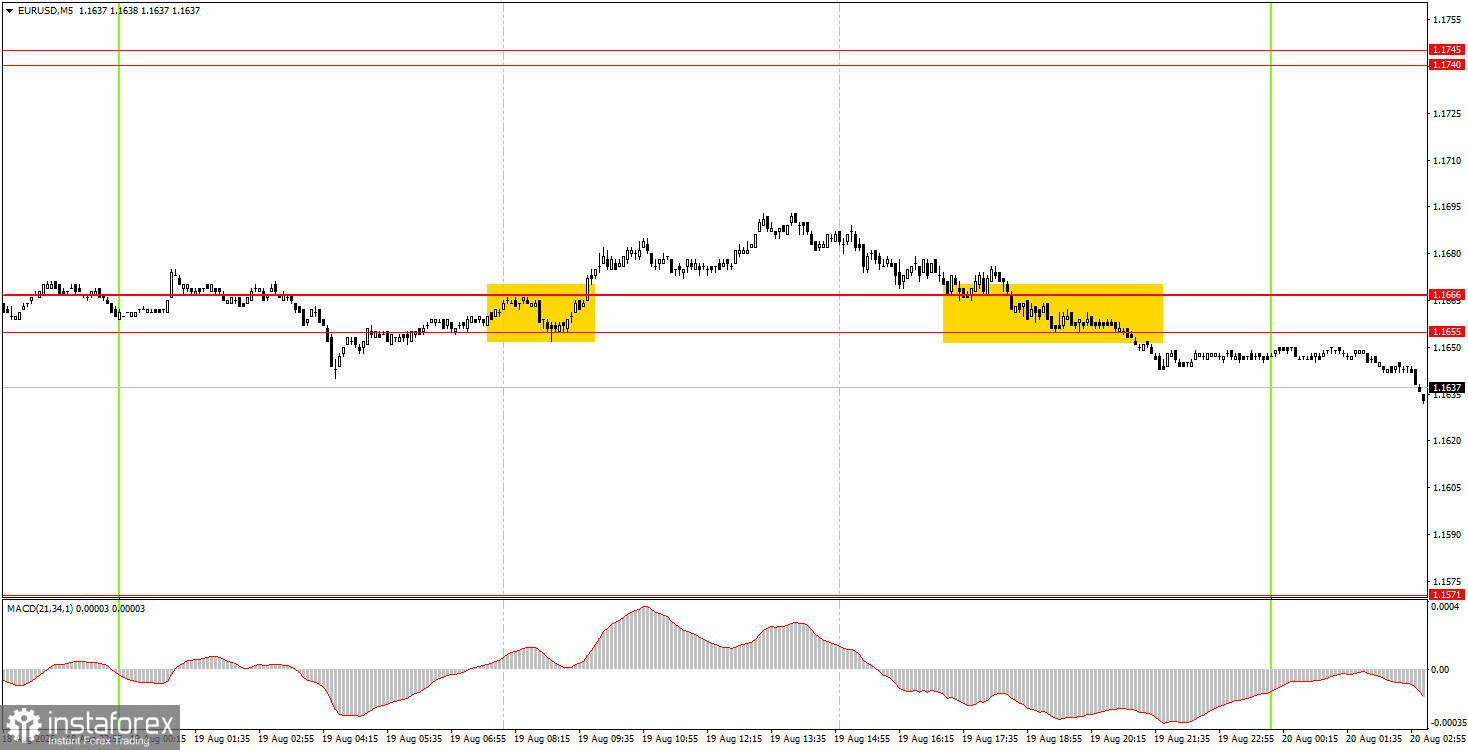
On the 5-minute timeframe, two trading signals formed on Tuesday, but they yielded no profit. The signals themselves were pretty decent, but the market showed virtually no movement.
On the hourly timeframe, EUR/USD still has every chance to continue the upward trend that has been developing since the beginning of this year. However, the market is currently in a flat phase, so one must first wait for its completion. We still see no grounds for a medium-term strengthening of the U.S. dollar, so we believe the dollar can only rely on minor technical corrections.
On Wednesday, EUR/USD may remain flat again, as no macroeconomic background will be present. Trading may be possible from the 1.1655–1.1666 area, but as Tuesday showed, signals can form without generating stronger moves.
On the 5-minute timeframe, the following levels should be considered: 1.1198–1.1218, 1.1267–1.1292, 1.1354–1.1363, 1.1413, 1.1455–1.1474, 1.1527, 1.1552–1.1563–1.1571, 1.1655–1.1666, 1.1740–1.1745, 1.1808, 1.1851, 1.1908. For Wednesday, the euro area will publish the second estimate of July's Consumer Price Index. Typically, the second estimate does not differ from the first, and in any case, inflation currently does not have a strong influence on the European Central Bank's monetary policy outlook, as the central bank has practically completed its rate-cutting cycle.
Support and Resistance Levels: These are target levels for opening or closing positions and can also serve as points for placing Take Profit orders.
Red Lines: Channels or trendlines indicating the current trend and the preferred direction for trading.
MACD Indicator (14,22,3): A histogram and signal line used as a supplementary source of trading signals.
Important Events and Reports: Found in the economic calendar, these can heavily influence price movements. Exercise caution or exit the market during their release to avoid sharp reversals.
Forex trading beginners should remember that not every trade will be profitable. Developing a clear strategy and practicing proper money management are essential for long-term trading success.
¡Los informes analíticos de InstaForex lo mantendrá bien informado de las tendencias del mercado! Al ser un cliente de InstaForex, se le proporciona una gran cantidad de servicios gratuitos para una operación eficiente.


