 Permanecer
Condiciones de negociación
Products
Herramientas


On Wednesday, the EUR/USD currency pair recovered from Tuesday's decline, just as we had warned. There were no strong reasons for the euro's tumble on Tuesday, and as usual, that day's macroeconomic stats actually supported the euro. Recall that rising inflation in the Eurozone means the European Central Bank is extremely unlikely to enact even one more round of monetary easing in 2025. Also, recall that the euro performed well even when the ECB was actively cutting the key rate and the Federal Reserve remained silent. Now, in September, the situation may become exactly the opposite: the Fed may start cutting its key rate, while the ECB says nothing. How the dollar should react to such a scenario is probably obvious to everyone.
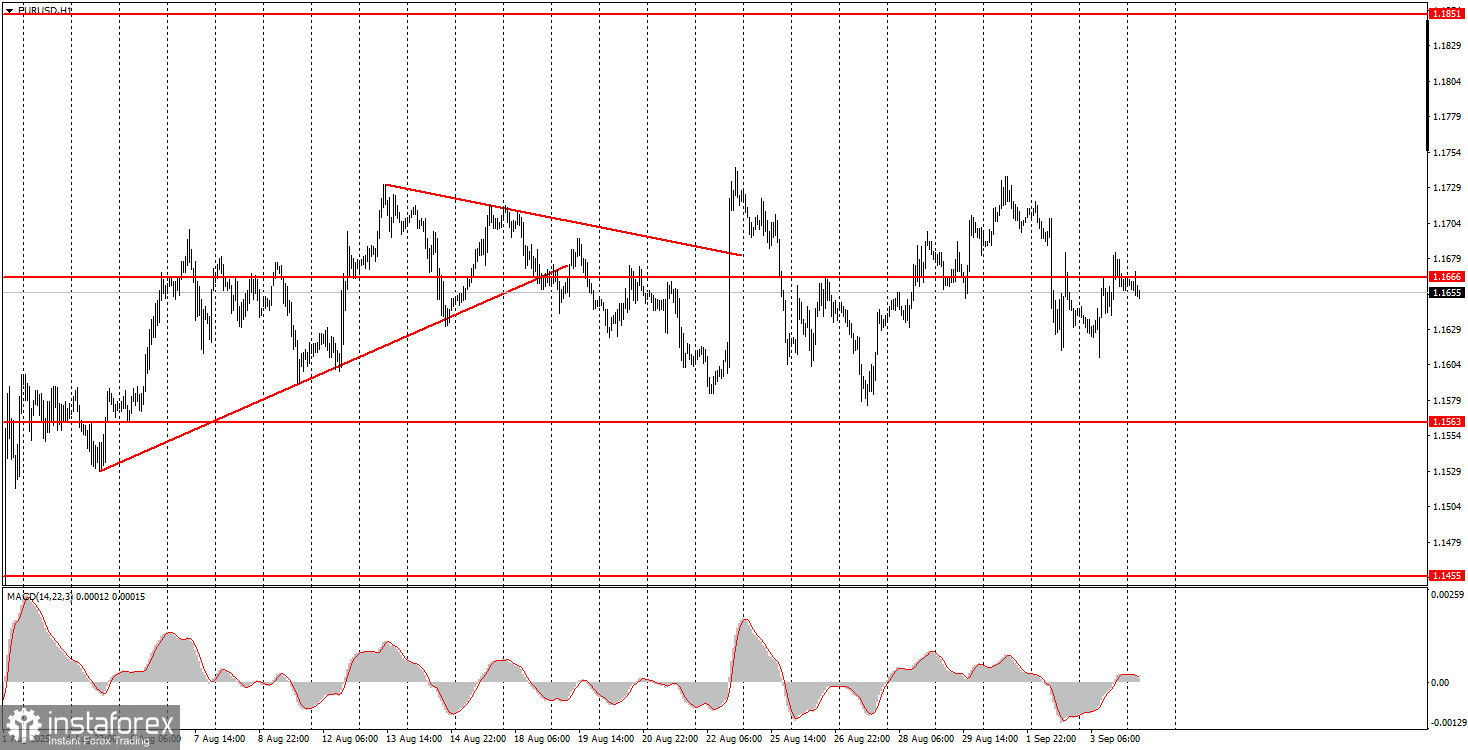
Also, on Tuesday, the ISM Manufacturing Index in the US delivered a weak reading, and on Wednesday, the JOLTs job openings report came out. Even though the JOLTs report is published with a two-month delay, it remains another indicator that has not pleased the dollar bulls. Thus, we still see no reason for the pair to fall or for the dollar to rise. On the hourly timeframe, the flat persists, which is clearly visible even from a kilometer away.
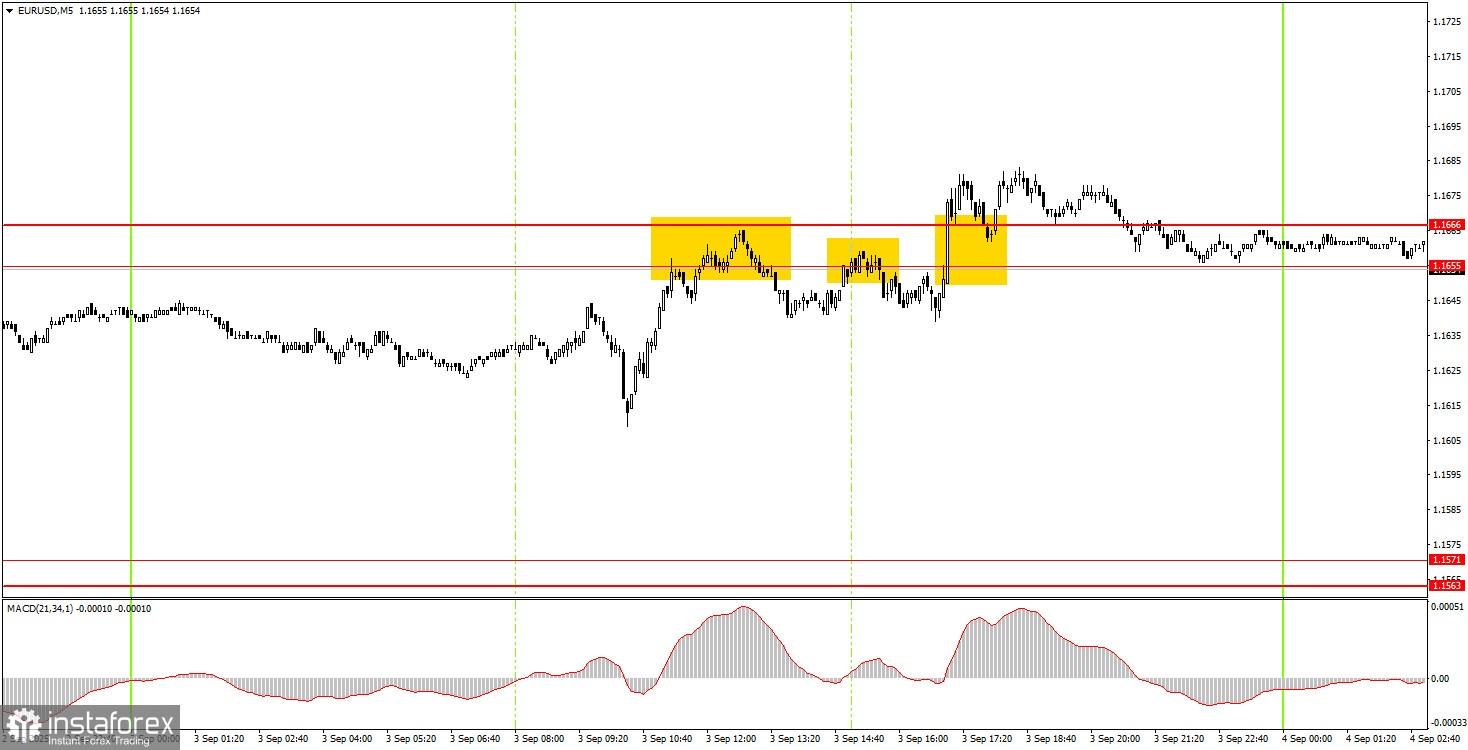
On the 5-minute chart on Wednesday, three trade signals were generated. Novice traders could have attempted any of them. However, the flat persists, meaning you shouldn't expect trending moves or high volatility. The signals themselves were quite decent, but if the market doesn't move, no signals will help.
On the hourly chart, EUR/USD still has every chance to renew the uptrend that has been forming since the start of the year, but for now, the flat remains. The fundamental and macroeconomic backdrop remains unfavorable for the US dollar, so we still do not expect dollar strength. In our view, as before, the US currency can only count on technical corrections.
On Thursday, the EUR/USD pair may trade in either direction, as the price remains inside the sideways channel. Right now, the price is around the 1.1655–1.1666 area, so you can open positions from here. A consolidation below this area means selling with a target of 1.1590. A consolidation above means buys with a target of 1.1730.
On the 5-minute chart, the levels to watch are: 1.1198–1.1218, 1.1267–1.1292, 1.1354–1.1363, 1.1413, 1.1455–1.1474, 1.1527, 1.1552–1.1563–1.1571, 1.1655–1.1666, 1.1740–1.1745, 1.1808, 1.1851, 1.1908. On Thursday, the Eurozone will publish a not-so-important retail sales report, while in the US, the far more significant ISM Services PMI will be out. This index could trigger a fresh drop in the dollar if it comes in below expert forecasts.
Support and Resistance Levels: These are target levels for opening or closing positions and can also serve as points for placing Take Profit orders.
Red Lines: Channels or trendlines indicating the current trend and the preferred direction for trading.
MACD Indicator (14,22,3): A histogram and signal line used as a supplementary source of trading signals.
Important Events and Reports: Found in the economic calendar, these can heavily influence price movements. Exercise caution or exit the market during their release to avoid sharp reversals.
Forex trading beginners should remember that not every trade will be profitable. Developing a clear strategy and practicing proper money management are essential for long-term trading success.
¡Los informes analíticos de InstaForex lo mantendrá bien informado de las tendencias del mercado! Al ser un cliente de InstaForex, se le proporciona una gran cantidad de servicios gratuitos para una operación eficiente.


