 Permanecer
Condiciones de negociación
Products
Herramientas


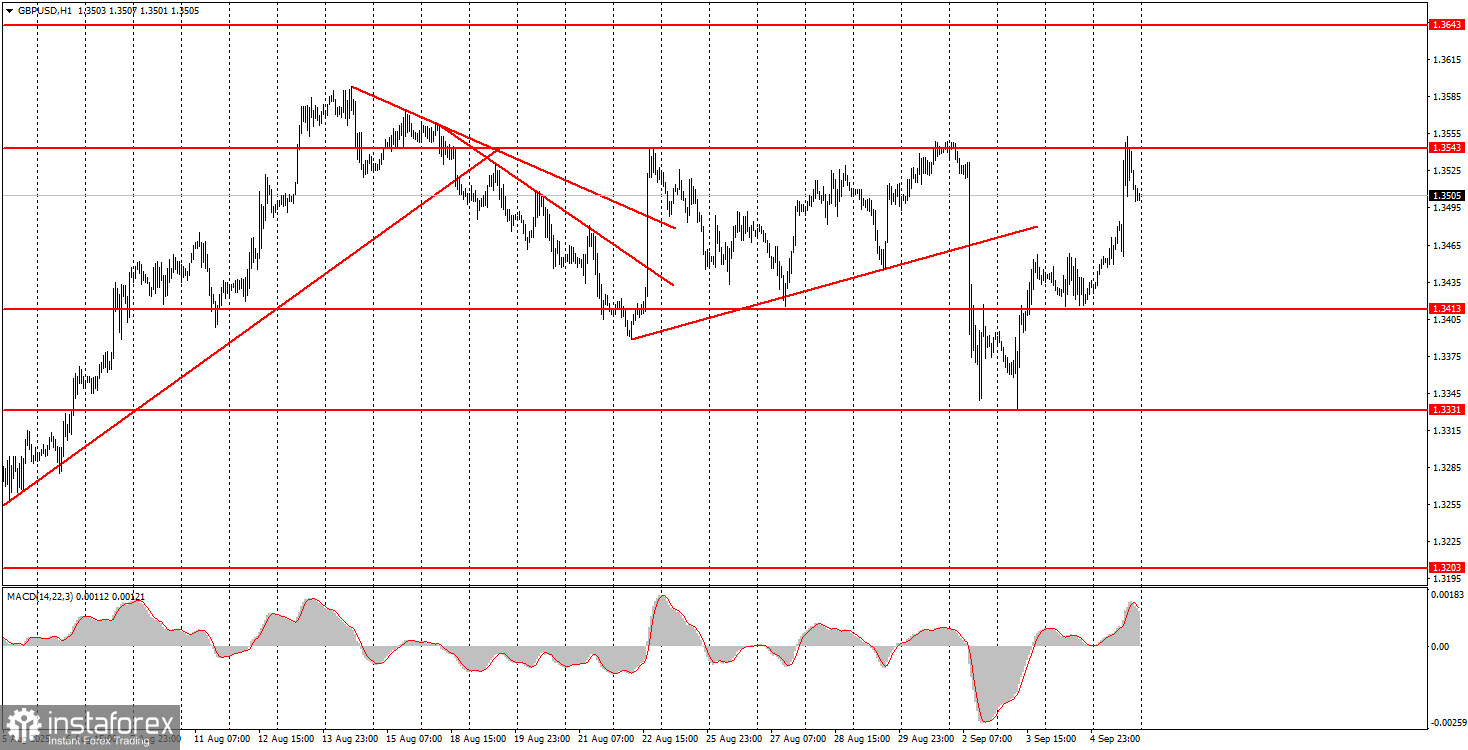
On Friday, the GBP/USD pair also showed a relatively strong upward movement, which was driven mainly by very weak US unemployment and labor market data. However, it's also worth noting that the pound's rally began during the night and was reinforced in the morning by a decent UK retail sales report. So, everything on Friday played in favor of the British currency—at least locally. Globally, the situation for the pound remains extremely favorable thanks to a whole series of factors working sharply against the US dollar. We mention this almost every day. At the moment, we cannot be sure that the sideways movement is over. On Friday, GBP/USD managed to climb to 1.3543—a level it had already tested twice before. Thus, a third bounce from this level is possible, keeping the sideways trend intact.
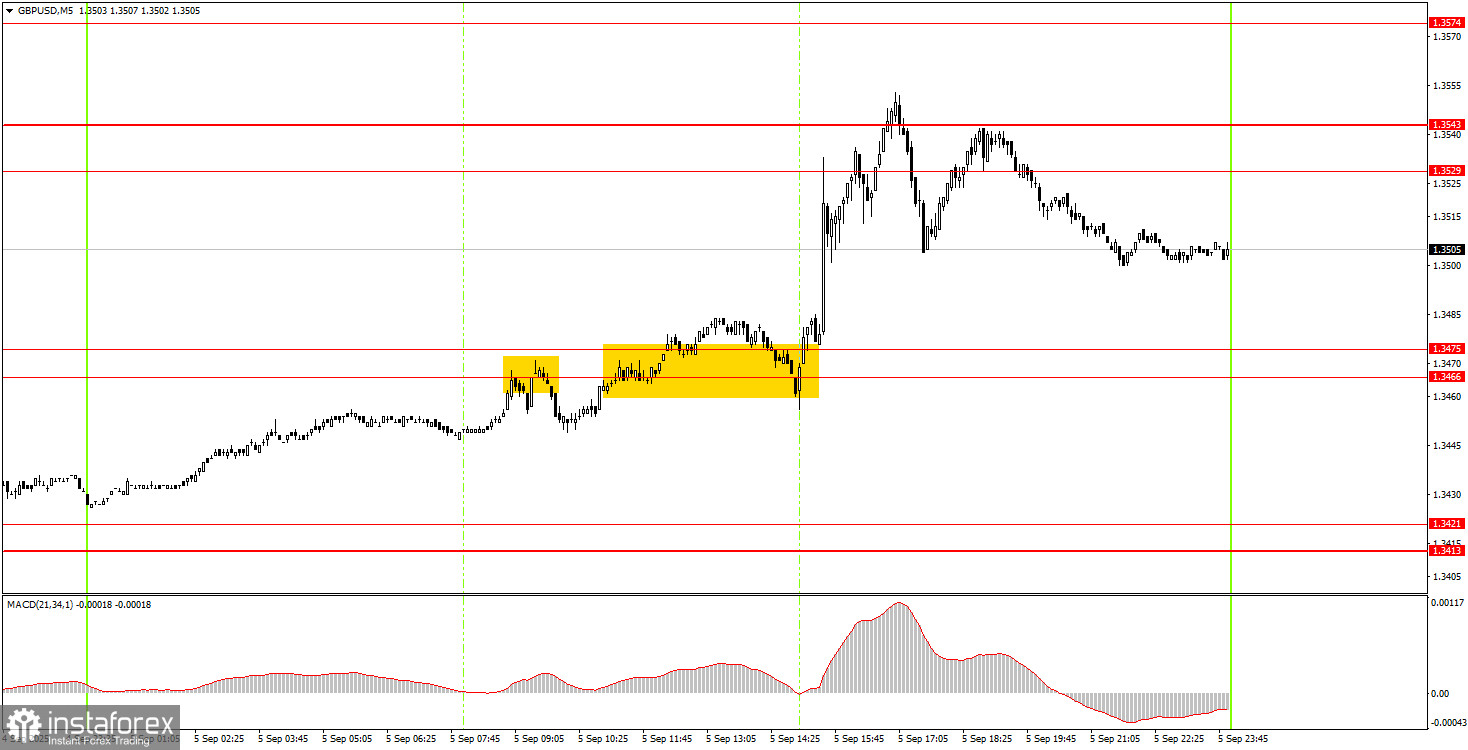
On the 5-minute chart on Friday, there were two trading signals that novice traders could have worked relatively safely. First, the price bounced from below the 1.3466–1.3475 area, but this sell signal turned out to be false. Then the pair broke through this area and later bounced from above, though not very precisely. This second signal formed just 15 minutes before the US data release, so it could only be traded with a Stop Loss. Following the US data's continued disappointment, we eventually saw the required upward movement, and the target area 1.3529–1.3543 was reached.
On the hourly chart, GBP/USD remains inside a sideways channel. On higher timeframes, the uptrend persists. Thus, the hourly chart movement we've seen in recent weeks is just a pause in the larger uptrend. As noted, there's no reason to expect a medium-term dollar rally, so we expect the flat to end and the pound to resume its rise.
On Monday, GBP/USD could well start a new downward phase, since the 1.3529–1.3543 zone has been tested three times but not breached. Therefore, the flat continues, and with no important events on Monday, low volatility can be expected.
On the 5-minute chart, the levels for trading are: 1.3102–1.3107, 1.3203–1.3211, 1.3259, 1.3329–1.3331, 1.3413–1.3421, 1.3466–1.3475, 1.3529–1.3543, 1.3574–1.3590, 1.3643–1.3652, 1.3682, 1.3763. On Monday, no significant events are scheduled for either the UK or the US, so traders will have nothing to react to during the day.
Support and Resistance Levels: These are target levels for opening or closing positions and can also serve as points for placing Take Profit orders.
Red Lines: Channels or trendlines indicating the current trend and the preferred direction for trading.
MACD Indicator (14,22,3): A histogram and signal line used as a supplementary source of trading signals.
Important Events and Reports: Found in the economic calendar, these can heavily influence price movements. Exercise caution or exit the market during their release to avoid sharp reversals.
Forex trading beginners should remember that not every trade will be profitable. Developing a clear strategy and practicing proper money management are essential for long-term trading success.
¡Los informes analíticos de InstaForex lo mantendrá bien informado de las tendencias del mercado! Al ser un cliente de InstaForex, se le proporciona una gran cantidad de servicios gratuitos para una operación eficiente.


