 Permanecer

Condiciones de negociación
Products
Herramientas


Trend analysis (Fig. 1).
This week, from the level of 1.1718 (close of the last weekly candle), the market may start moving downward with a target of 1.1536 – the 38.2% retracement level (blue dotted line). Upon testing this level, the price may begin moving upward with a target of 1.1571 – the upper fractal (red dotted line).
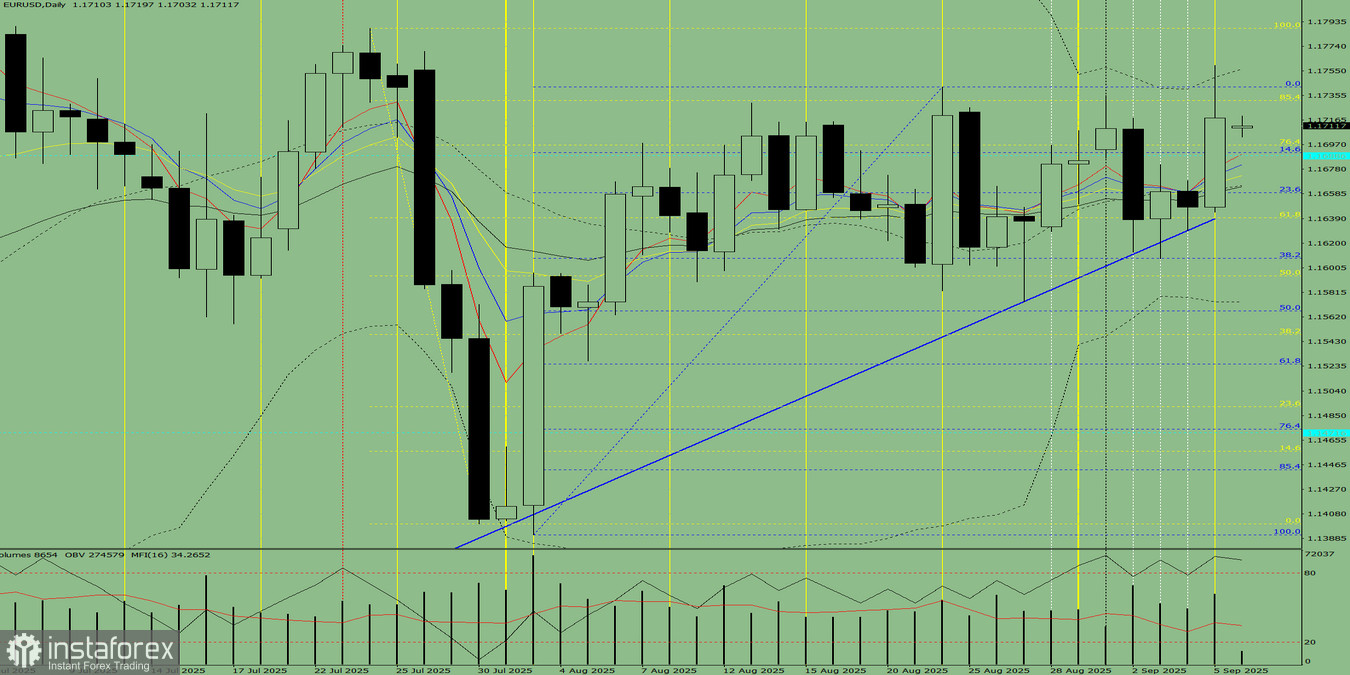
Fig. 1 (weekly chart).
Comprehensive analysis:
Conclusion from comprehensive analysis: Downward movement.
Overall summary of the EUR/USD weekly candle calculation: The price will most likely have a downward tendency during the week, with the absence of the first upper shadow on the weekly black candle (Monday – down) and the presence of the second lower shadow (Friday – up).
Alternative scenario: From the level of 1.1718 (close of the last weekly candle), the pair may begin moving downward with a target of 1.1498 – the 85.4% retracement level (red dotted line). Upon testing this level, the price may then move upward with a target of 1.1536 – the 38.2% retracement level (blue dotted line).
¡Los informes analíticos de InstaForex lo mantendrá bien informado de las tendencias del mercado! Al ser un cliente de InstaForex, se le proporciona una gran cantidad de servicios gratuitos para una operación eficiente.


