 Permanecer
Condiciones de negociación
Products
Herramientas


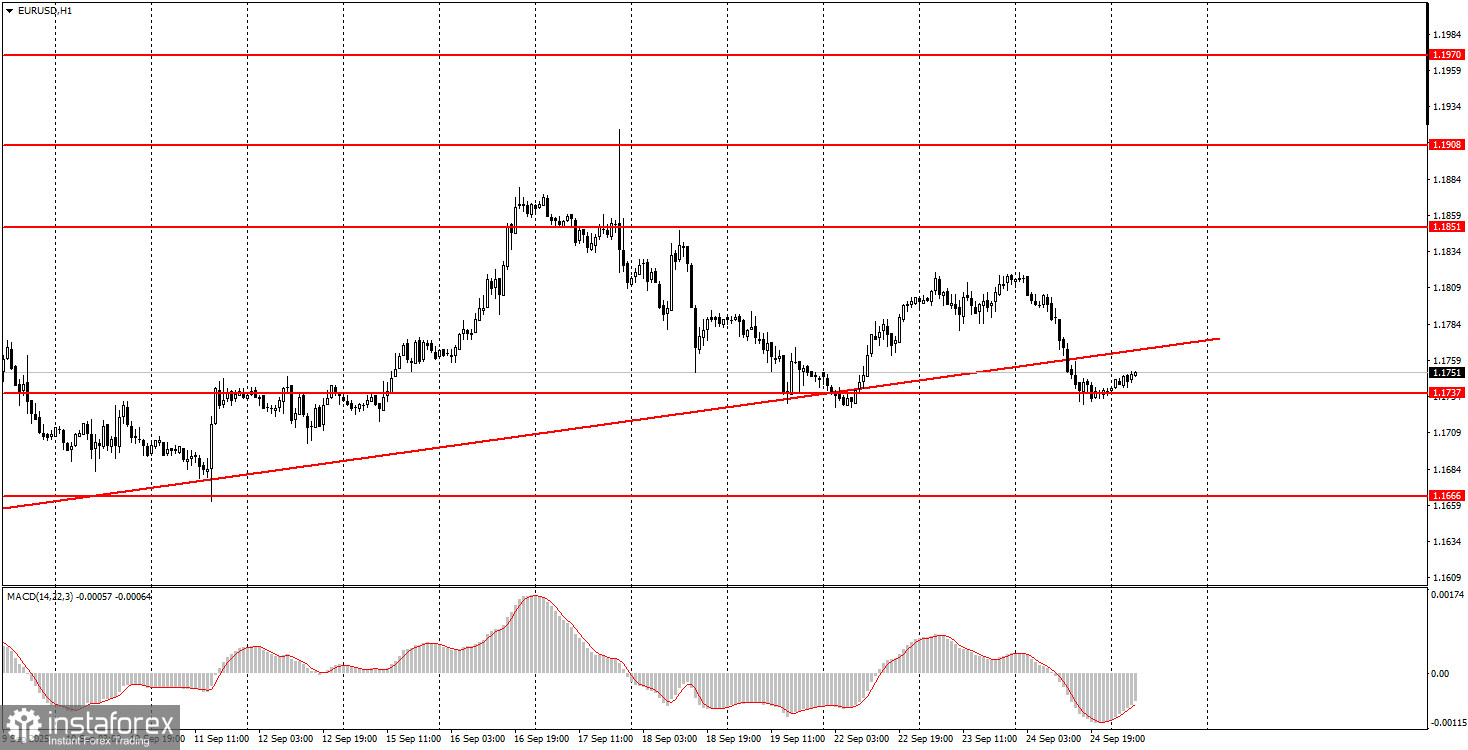
On Wednesday, the EUR/USD currency pair fell unexpectedly and even consolidated below the ascending trendline. In fact, the recent decline in the pair occurred for no clear reason. We didn't see and still don't see any solid fundamental or macroeconomic grounds for the euro's drop, especially yesterday. Nevertheless, the technical picture is now bearish, but not everything is so straightforward.
The 1.1737 level has halted the euro's decline for the second time. Therefore, we believe the fall may finish here. Traders are in a favorable position now: if the price breaks below 1.1737, everything will become clear—the trend has turned bearish and a sell signal has been formed. However, if the pair rebounds from this level, we'd also consider longs, because there are hardly any reasons for a continued drop.
Yesterday, there was no major macroeconomic or fundamental news out of the Eurozone or the US, so technical and market factors drove the downward movement.
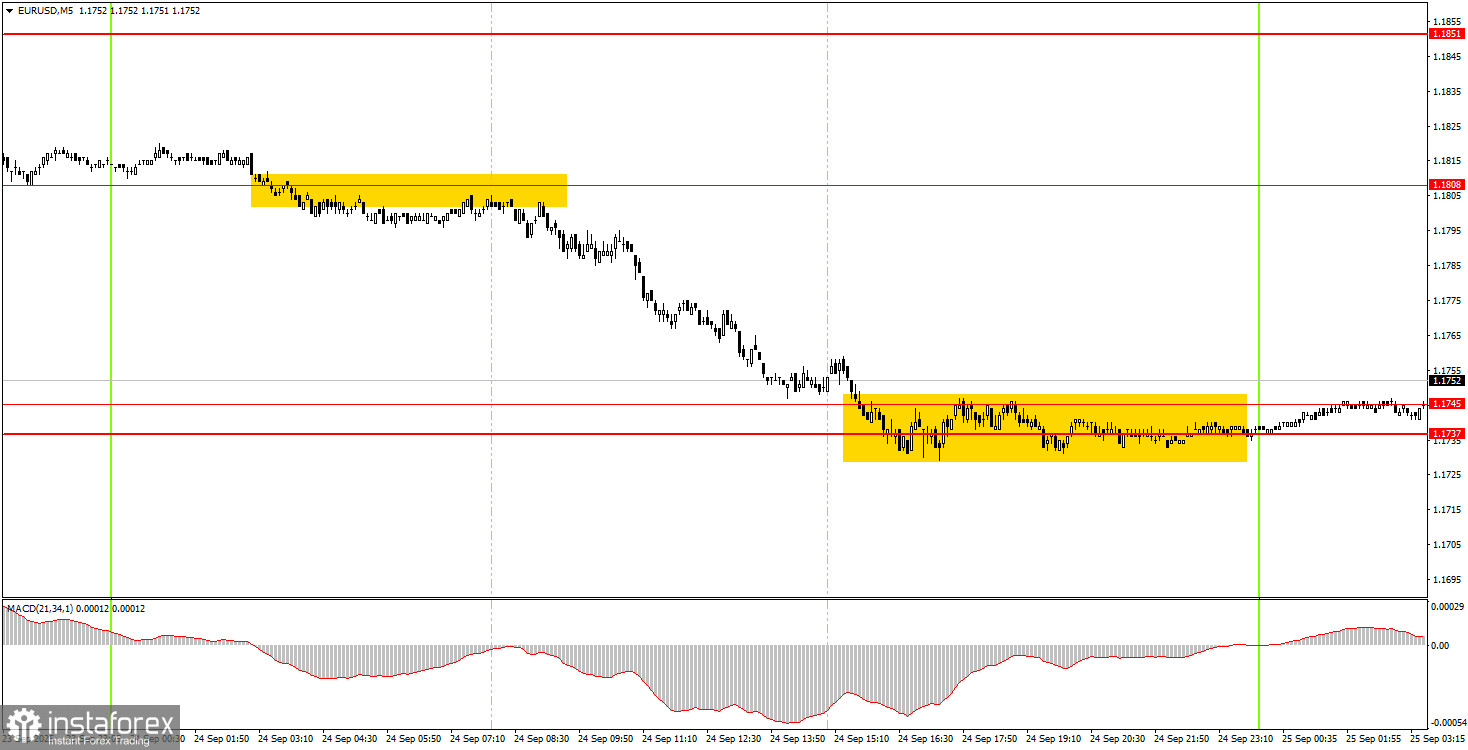
On the 5-minute timeframe on Wednesday, there was precisely one trade signal, but it was enough for novice traders to make a decent profit. During the Asian and early European sessions, price formed a signal near 1.1808, from where it dropped to the 1.1737–1.1745 area, where the fall halted for now. Thus, about 50 pips could have been earned on this single trade.
On the hourly timeframe, EUR/USD still maintains excellent upside potential despite breaking below the trendline. The dollar's fundamental and macro backdrop remains very weak, so we still do not expect any strong USD appreciation. In our view, as before, the dollar can only count on technical corrections, one of which we've been observing over the past week. The FOMC meeting did absolutely nothing to change the greenback's outlook.
On Thursday, the EUR/USD may resume its upward move, as most factors still favor the euro only if the pair breaks below the 1.1737–1.1745 area (targeting 1.1655–1.1666) should a further drop be expected.
For the 5-minute chart, watch these levels: 1.1354–1.1363, 1.1413, 1.1455–1.1474, 1.1527, 1.1571–1.1584, 1.1655–1.1666, 1.1737–1.1745, 1.1808, 1.1851, 1.1908, 1.1970–1.1988.
On Thursday, the main events to watch are the US reports on durable goods orders and the third estimate of Q2 GDP. These figures could prompt a market reaction.
Support and Resistance Levels: These are target levels for opening or closing positions and can also serve as points for placing Take Profit orders.
Red Lines: Channels or trendlines indicating the current trend and the preferred direction for trading.
MACD Indicator (14,22,3): A histogram and signal line used as a supplementary source of trading signals.
Important Events and Reports: Found in the economic calendar, these can heavily influence price movements. Exercise caution or exit the market during their release to avoid sharp reversals.
Forex trading beginners should remember that not every trade will be profitable. Developing a clear strategy and practicing proper money management are essential for long-term trading success.
¡Los informes analíticos de InstaForex lo mantendrá bien informado de las tendencias del mercado! Al ser un cliente de InstaForex, se le proporciona una gran cantidad de servicios gratuitos para una operación eficiente.


