 Permanecer
Condiciones de negociación
Products
Herramientas


The EUR/USD currency pair continued to decline throughout Thursday. Overall, even if we were to gather all possible factors that could support the U.S. dollar and ignore all the ones that oppose it, even then, such dollar strength would hardly be justified.
The only significant event on Thursday was Federal Reserve Chair Jerome Powell's speech. However, the dollar began to strengthen earlier in the day, which once again highlights the illogical nature of the current market behavior.
Perhaps the market has completely changed its attitude toward Donald Trump's policies and now, for example, views them positively. But from our perspective, there should be some visible positive results of those policies before one can confidently look forward to growth in the U.S. economy.
Now back to Powell's speech — the Fed Chair hardly touched on monetary policy and gave no clear signals about easing at the next meeting. What does this change? Nothing. The absence of comments on monetary policy doesn't mean that it won't happen or that the Fed has abandoned the dovish scenario. Still, the market, for some reason, is buying the dollar regardless of justification. It sounds strange in 2025, but this is the objective reality.
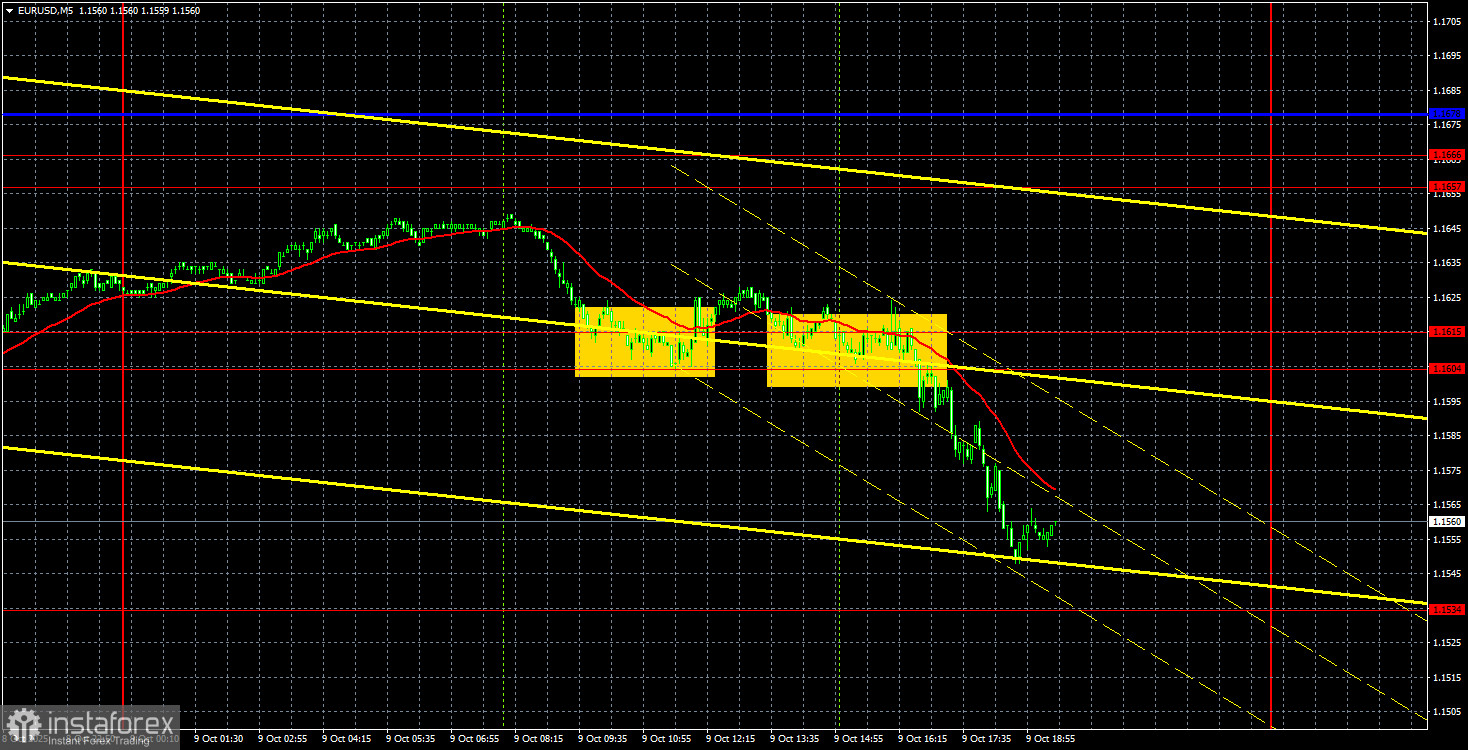
On the 5-minute timeframe, two trading signals were formed. First, the pair attempted a slight rebound from the 1.1604–1.1615 area, followed by a breakout of this zone. The first signal turned out to be false, while the second was profitable.
On the 1-hour chart, a descending trendline has formed, giving traders a technical reference. Despite the fundamentally ungrounded drop in the pair, a potential trend reversal can be assessed by observing whether the price breaks through the trendline.
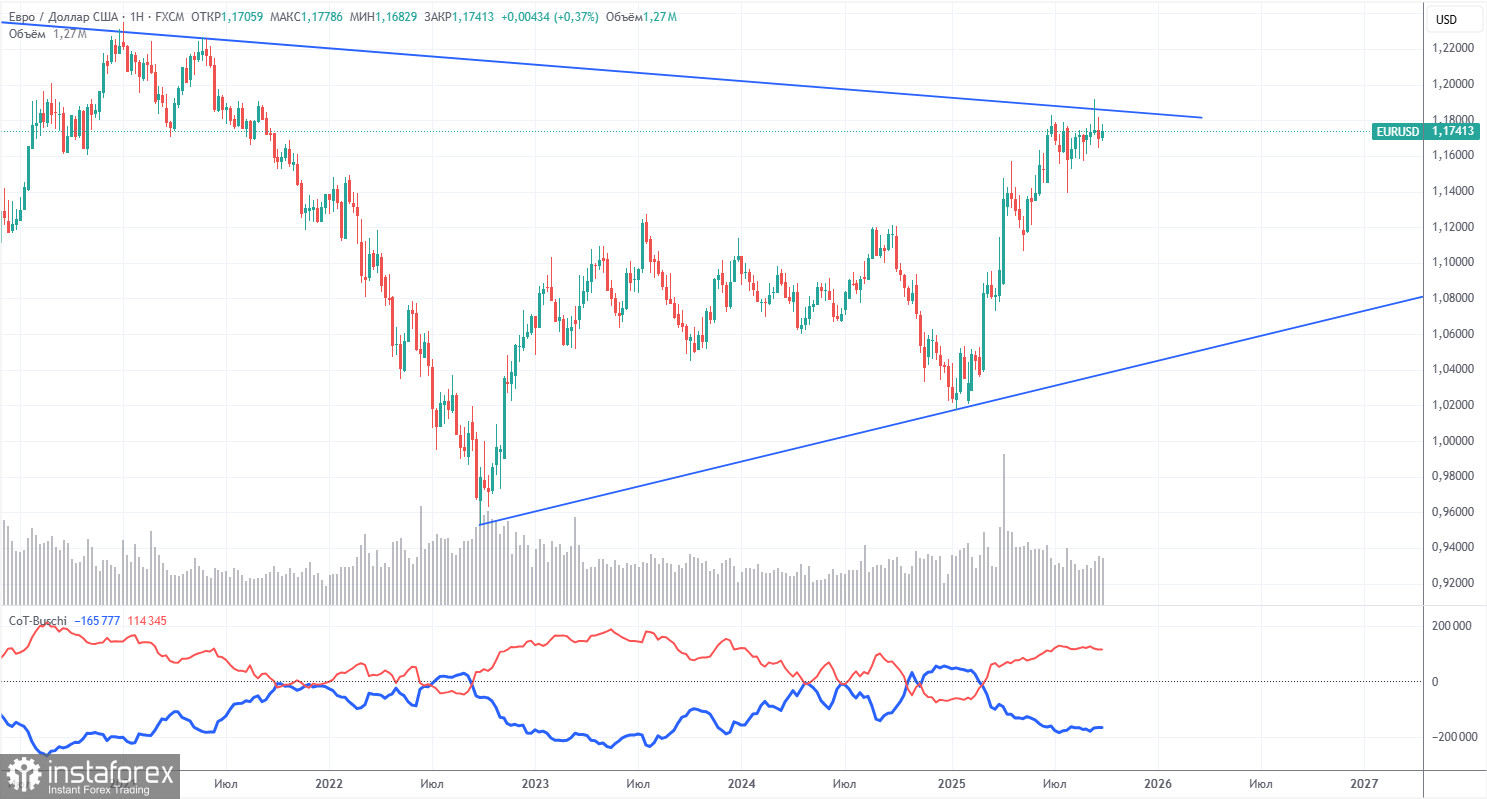
The latest COT report is dated September 23. The chart above clearly shows that the net position of non-commercial traders had been bullish for quite some time. Bears briefly took control at the end of 2024, but quickly lost their advantage.
Ever since Trump began his second term as president, only the U.S. dollar has been falling. We can't say with 100% certainty that the dollar's decline will continue, but current global developments point to that scenario.
We still see no strong fundamental factors for euro strength, but plenty of reasons remain for further dollar weakness. The global downtrend remains intact — but what's the point of looking back 17 years to see where price once moved?
Once Trump ends his trade wars, the dollar may strengthen again. But recent events suggest that this war will persist in one form or another.
A potential loss of Federal Reserve independence is yet another powerful factor weighing on the U.S. currency.
The position of the red and blue indicator lines still suggests the bullish trend is intact.
During the most recent reporting week:
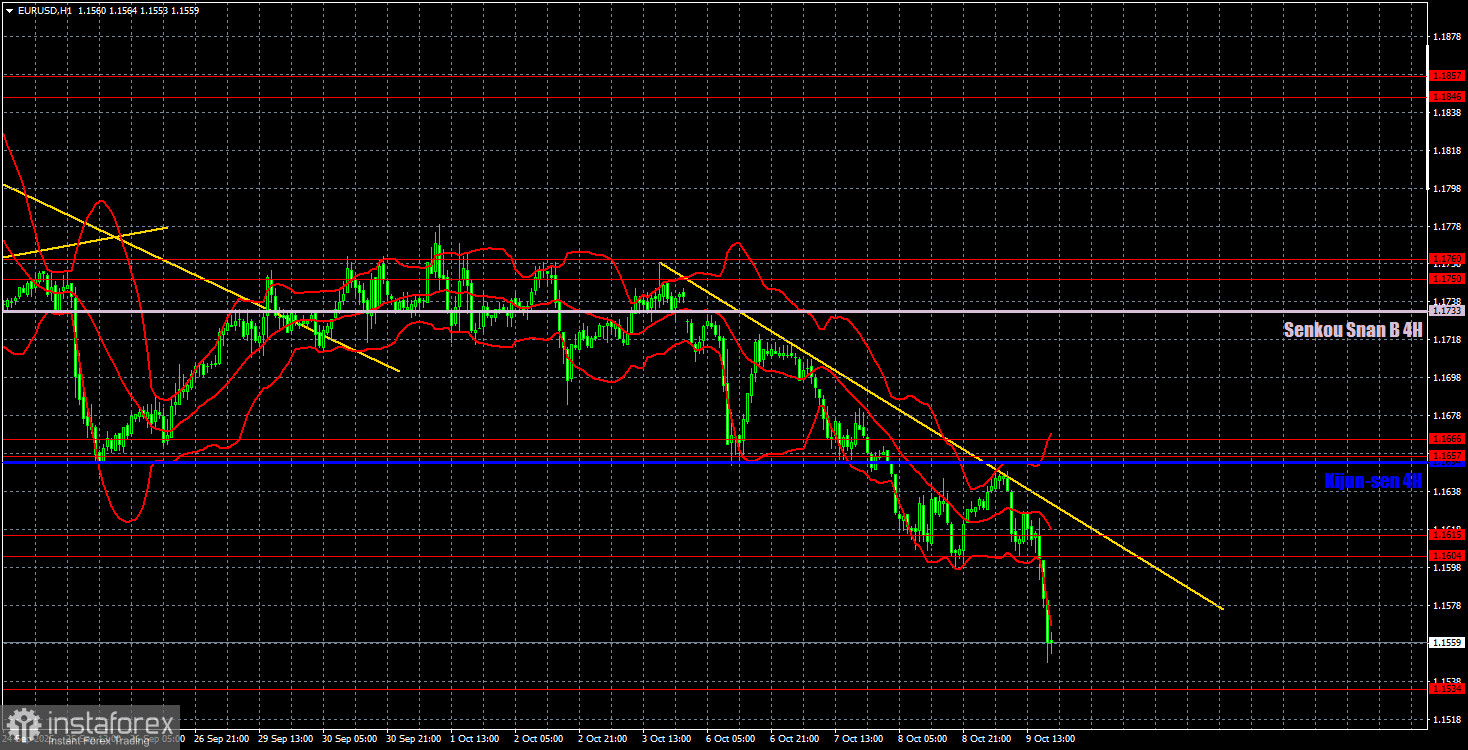
On the 1-hour chart, the EUR/USD pair continues to develop a downward trend. While we still don't see any solid reasons for the dollar's rally, the price continues to break through one support zone after another.
We consider the pair's decline irrational, but it is what it is. On the daily chart, the prevailing trend remains upward.
For October 10, we highlight the following levels for trading: 1.1234, 1.1274, 1.1362, 1.1426, 1.1534, 1.1604–1.1615, 1.1657–1.1666, 1.1750–1.1760, 1.1846, 1.1857, 1.1922, 1.1971–1.1988, as well as the Senkou Span B line at 1.1733 and the Kijun-sen line at 1.1657. Note: Ichimoku indicator lines can shift throughout the day, so account for these possibilities when interpreting trading signals. Don't forget: If the price moves 15 pips in the right direction, set your Stop Loss to breakeven — this will protect against losses in case a signal fails.
On Friday, the University of Michigan Consumer Sentiment Index will be published in the U.S. — the only notable event of the day. And honestly, we wouldn't be surprised if it sparks further dollar growth, because at this point, the market seems to need no reason at all to buy the greenback.
On Friday, traders can work off the 1.1534 level. A breakthrough of this level will open the way to 1.1426. A bounce will allow a correction back to 1.1604–1.1615 and toward the trendline. We would assume that today might bring an upward correction since this week's dollar rally seems totally undeserved. However, the market may very well continue buying the dollar — because right now, it doesn't even need a reason to do so.
¡Los informes analíticos de InstaForex lo mantendrá bien informado de las tendencias del mercado! Al ser un cliente de InstaForex, se le proporciona una gran cantidad de servicios gratuitos para una operación eficiente.


