 Permanecer
Condiciones de negociación
Products
Herramientas


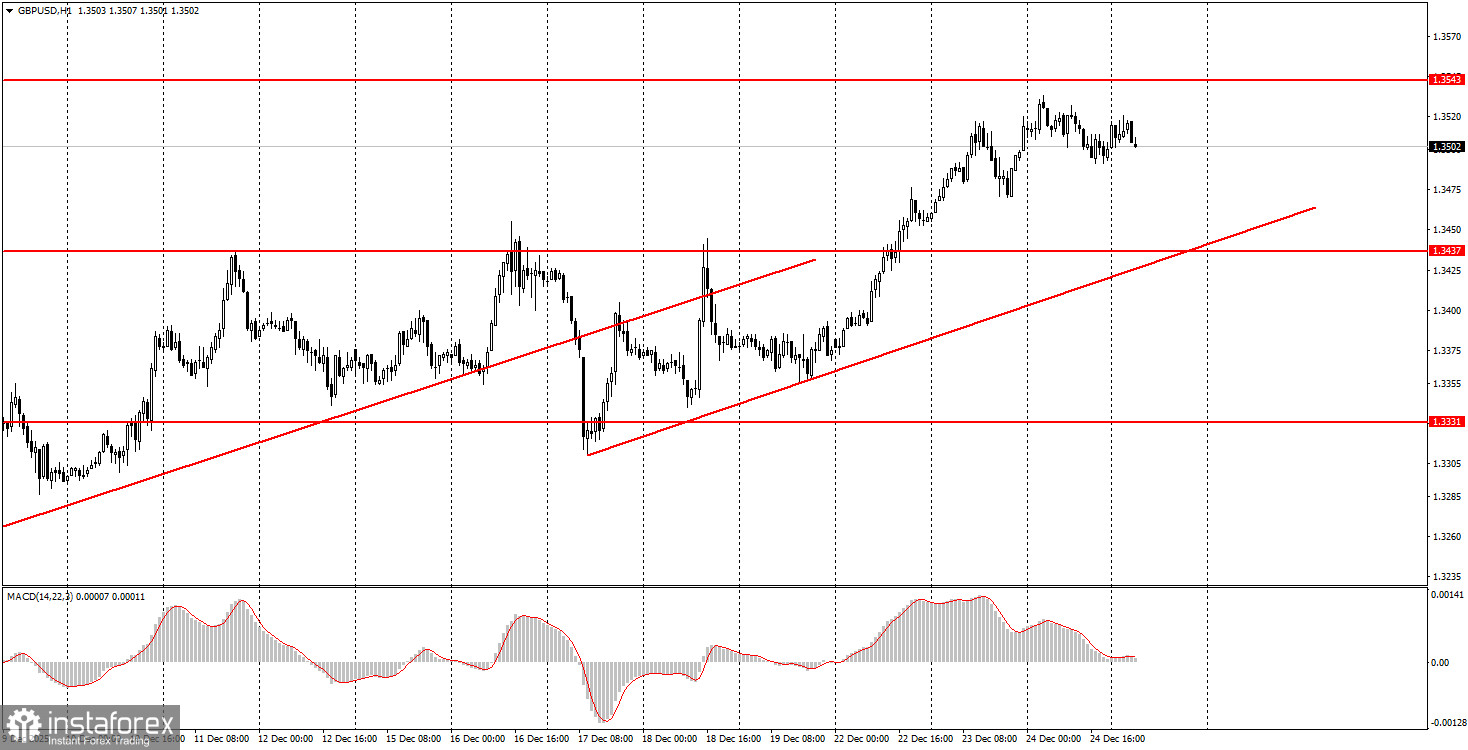
The GBP/USD pair moved similarly to the EUR/USD pair on Wednesday. The attempt to continue the upward movement ended without result, and a downward correction began, which is ongoing today. Volatility was ultra-low, but the upward trend is still intact. It can be said that the dollar received minimal support from the U.S. jobless claims report, which came in below forecasts; however, this report is absolutely secondary. In any case, there was virtually no movement throughout Wednesday. Thus, trading shifts to Friday and is likely to continue into next week. From our perspective, the British pound is expected to continue rising at the beginning of 2026, as suggested by nearly all timeframes. The macroeconomic and fundamental background has been absent for the past two days in both the UK and the U.S.

On the 5-minute timeframe, two trading signals were generated on Wednesday, which novice traders could have capitalized on if they wished. The price bounced twice from the level of 1.3529, which is part of the area 1.3529-1.3543. In both instances, the price moved down by about 20 pips. Today, the decline may continue, but it is unlikely to be strong.
On the hourly timeframe, the GBP/USD pair has completed its flat and has once again started moving upwards. We fully support this development, as previously mentioned. There are no global grounds for medium-term dollar growth, so we anticipate movement only to the upside. Overall, we expect the global upward trend to resume in 2025, which could push the pair to the 1.4000 mark in the next couple of months.
On Friday, novice traders can consider new long positions if the price breaks the 1.3529-1.3543 area, targeting 1.3574-1.3590. Short positions will become relevant upon a new bounce from the area of 1.3529-1.3543, targeting 1.3437-1.3446.
On the 5-minute timeframe, trading can currently occur at the levels: 1.2913, 1.2980-1.2993, 1.3043, 1.3096-1.3107, 1.3203-1.3212, 1.3259-1.3267, 1.3319-1.3331, 1.3437-1.3446, 1.3529-1.3543, 1.3574-1.3590. There are no significant events scheduled in the UK or the U.S. on Friday, and market volatility has decreased following the relatively active Monday and Tuesday. The market is currently "thin," making it easier for market makers to move the price than usual, but this does not automatically mean they want to do so.
Important Note: Significant speeches and reports (always included in the news calendar) can greatly influence the movement of the currency pair. Therefore, during their release, it is advisable to trade cautiously or exit the market to avoid sharp reversals against the preceding movement.
Remember: For beginners trading in the Forex market, it is important to understand that not every trade can be profitable. Developing a clear strategy and practicing money management are keys to long-term trading success.
¡Los informes analíticos de InstaForex lo mantendrá bien informado de las tendencias del mercado! Al ser un cliente de InstaForex, se le proporciona una gran cantidad de servicios gratuitos para una operación eficiente.


