 Permanecer
Condiciones de negociación
Products
Herramientas


The EUR/USD currency pair soared on Friday but... remained within the sideways channel on the daily timeframe of 1.1400-1.1830. The European currency has been trading in this channel for 7 months, closing Friday at 1.1828. Thus, the pair is currently undergoing another test of the upper boundary of the sideways channel. We believe that this week's movements will depend 90% on technical factors. If the area between 1.1800 and 1.1830 is breached, the upward movement will continue regardless of the fundamental and macroeconomic backdrop. Moreover, the market has been paying little attention to economic reports lately. If a rebound occurs from the area of 1.1800-1.1830, we should expect a new round of decline within the sideways channel.
On Friday, a considerable amount of diverse reports was published in the Eurozone, Germany, and the US. Now, take a look at the charts of the pair. Do you get the feeling that the pair's growth of 100 pips was provoked by any report? First of all, the growth began during the American trading session. During the European trading session, volatility was minimal, and prices traded sideways. Thus, the entire morning statistical package was completely ignored. In the second half of the day, the U.S. S&P business activity indices were slightly weaker than forecasts (and could hardly trigger a 1-cent drop in the dollar within a few hours), while the consumer sentiment index from the University of Michigan showed a positive value (and, consequently, could also not provoke a drop in the dollar).
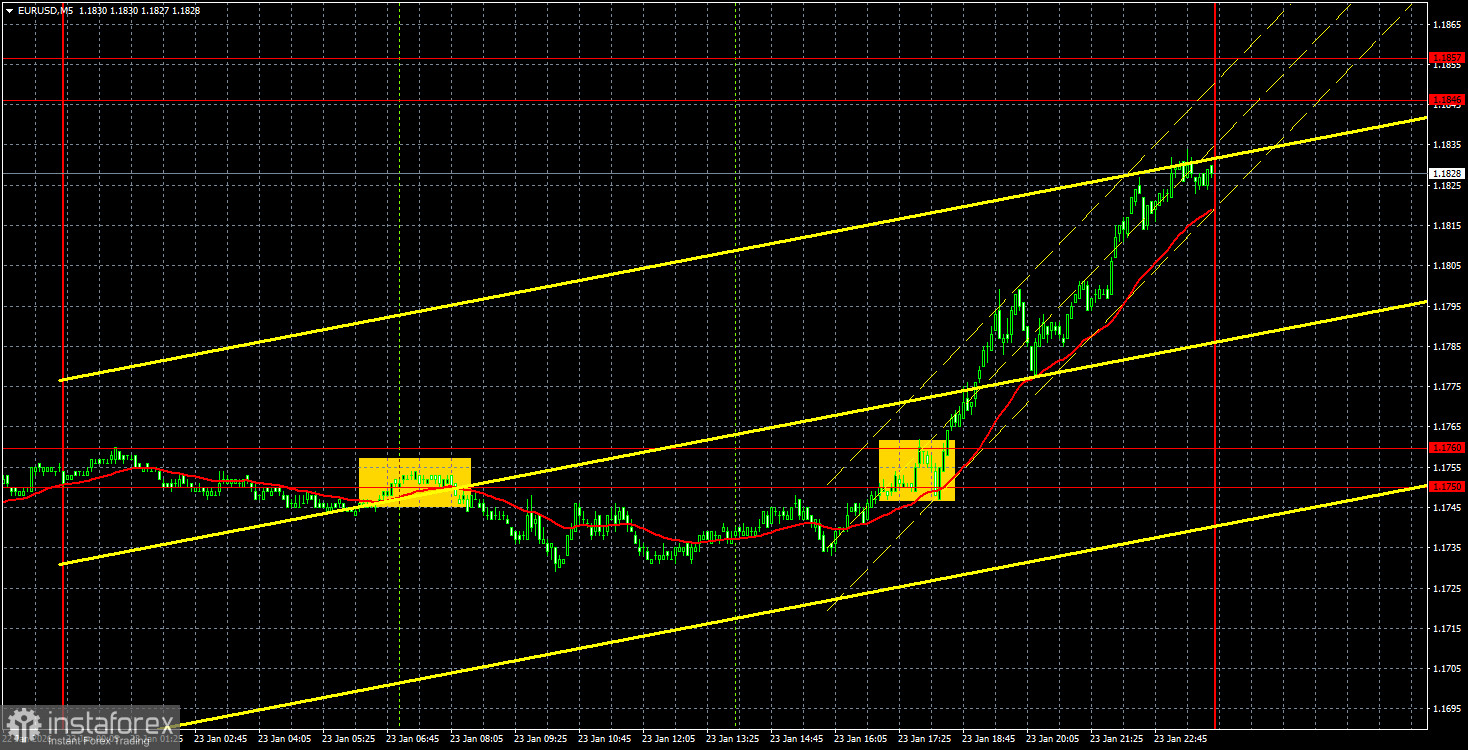
On the 5-minute timeframe, two trading signals were formed on Friday. The first was formed in the morning, and this was the only trade that traders could open. The price bounced twice off the Senkou Span B line, then began a sustained upward move. By the end of the day, the pair managed to gain about 60 pips, which traders could comfortably pocket.
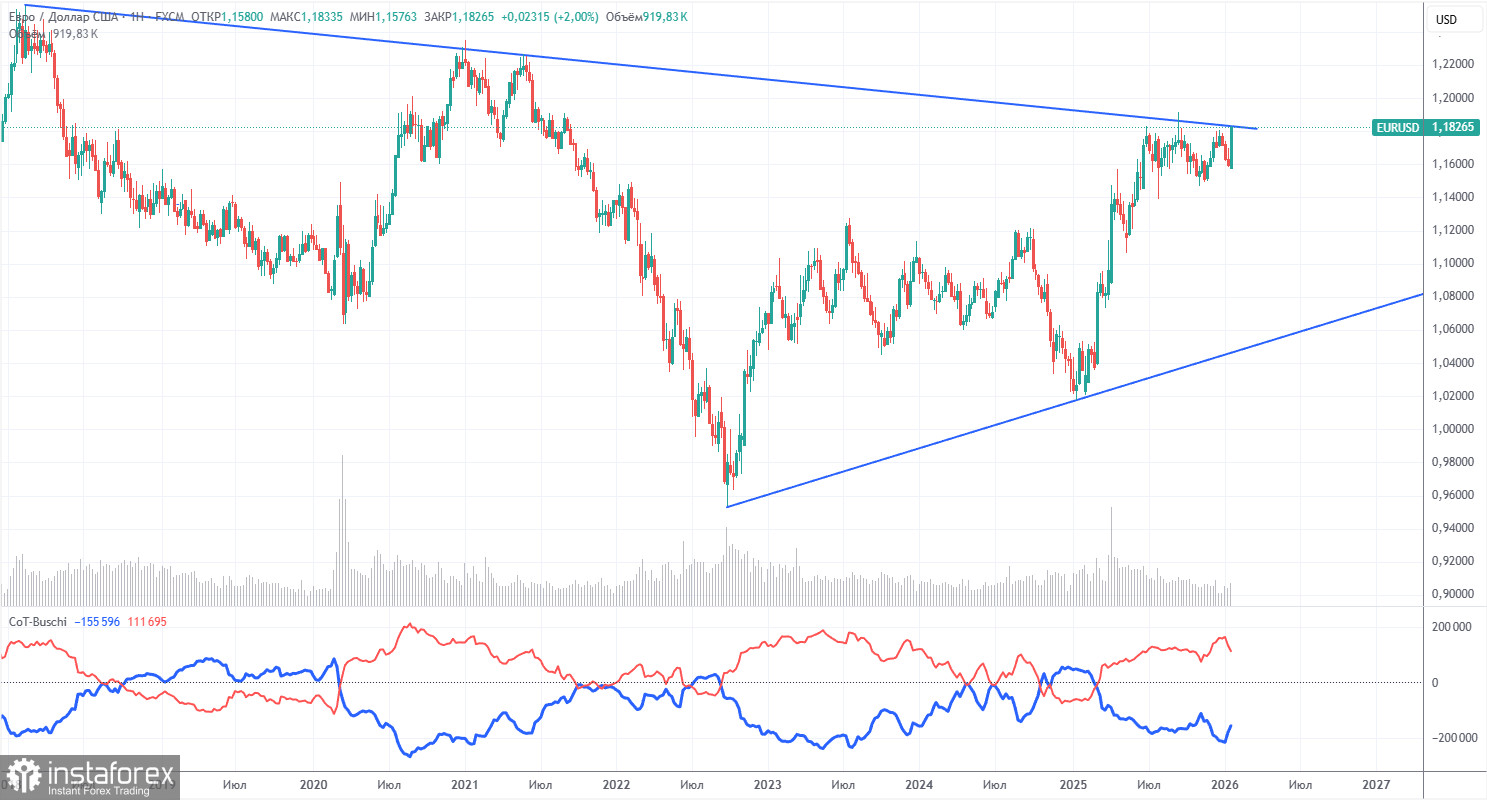
The latest COT report is dated January 20. The illustration above clearly shows that the net position of non-commercial traders remains "bullish." Since Trump took office as president of the United States for the second time, only the dollar has been falling. We cannot say that the decline of the American currency will continue with 100% probability, but the current developments in the world suggest this possibility.
We still do not see any fundamental factors for the strengthening of the European currency, but there are enough factors for the decline of the American currency. The global downward trend still persists, but what difference does it make where the price has moved in the last 18 years? A new upward trend has been forming over the past three years, and in the coming weeks, the price could break the global descending trendline, confirming further long-term growth.
The positioning of the red and blue lines in the indicator continues to indicate the maintenance and strengthening of the "bullish" trend. Over the last reporting week, the number of longs for the "Non-commercial" group decreased by 8,400, while the number of shorts increased by 12,600. Consequently, the net position fell by 21,000 contracts over the week.
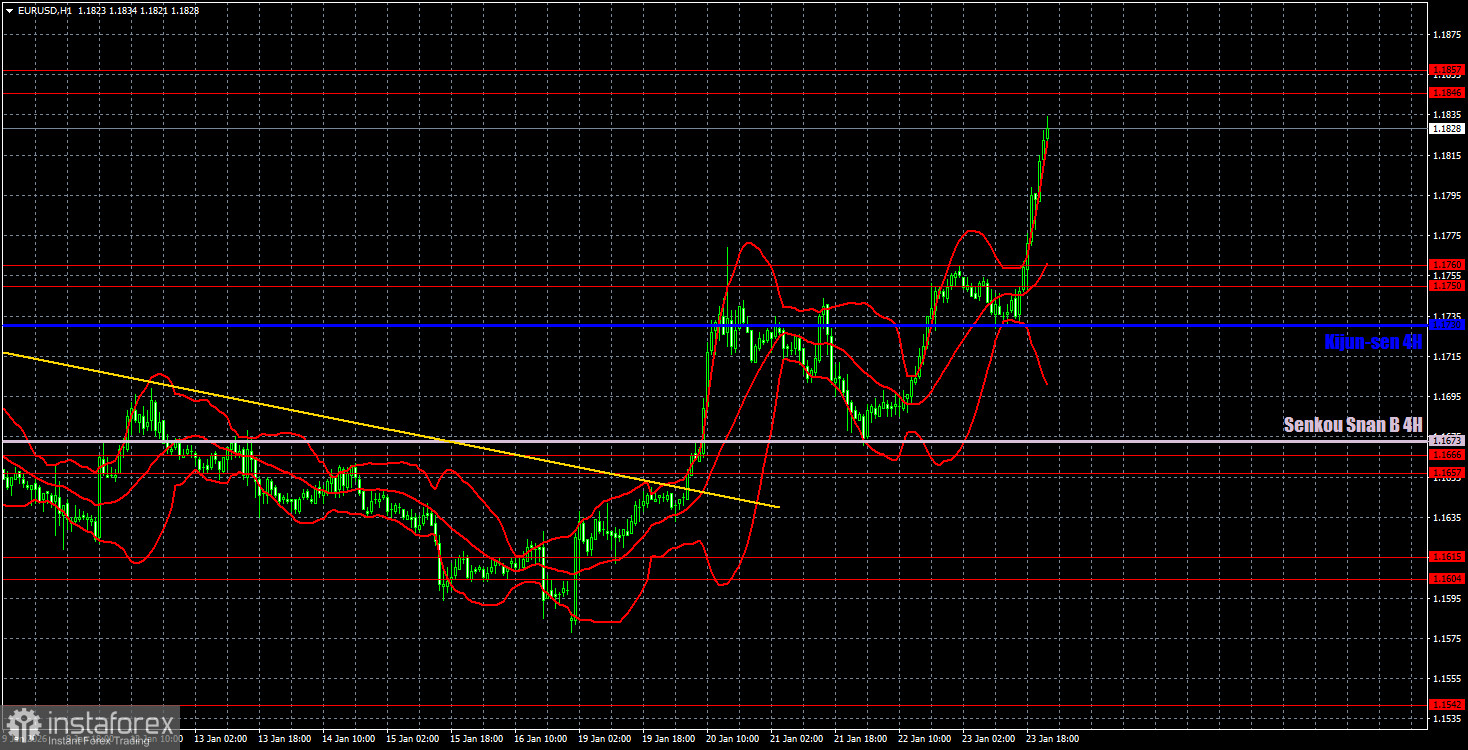
On the hourly timeframe, the EUR/USD pair continues to form a local upward trend and is currently near the upper boundary of the sideways channel of 1.1400-1.1830. Thus, the fate of the pair for the coming weeks and months will be determined soon. Either the flat will continue, or the global upward trend will resume. The fundamental and macroeconomic background continues to support not the dollar.
For January 26, we highlight the following trading levels—1.1234, 1.1274, 1.1362, 1.1426, 1.1542, 1.1604-1.1615, 1.1657-1.1666, 1.1750-1.1760, 1.1802-1.1830, 1.1922, 1.1971-1.1988, as well as the Senkou Span B line (1.1673) and Kijun-sen line (1.1730). The Ichimoku indicator lines may move throughout the day, which should be taken into account when determining trading signals. Don't forget to set a Stop Loss order to break even if the price moves in the correct direction by 15 pips. This will protect against potential losses if the signal turns out to be false.
On Monday, there are no important events or reports scheduled in the UK, while the U.S. will release a relatively important report on durable goods orders, which may reflect in the charts.
On Monday, traders can trade in the 1.1800-1.1830 range. Since the effective level of 1.1830 has been reached, trading can be done specifically from this level rather than the entire area. A rebound from this level will allow for new short positions with a target of 1.1750-1.1760. A consolidation above 1.1830 will make longs targeting 1.1922 relevant.
¡Los informes analíticos de InstaForex lo mantendrá bien informado de las tendencias del mercado! Al ser un cliente de InstaForex, se le proporciona una gran cantidad de servicios gratuitos para una operación eficiente.


