 Permanecer
Condiciones de negociación
Products
Herramientas


On Tuesday, the EUR/USD pair was no longer simply continuing its rise. It was a flight from the market by bears and all supporters of the US currency. By the end of the day, the pair reached the 200.0% corrective level at 1.2031, even though just a week ago the dollar was trading three cents higher. Today, a rebound from this level would work in favor of the US currency and lead to a moderate decline toward the 1.1945 and 1.1867 levels. A consolidation above 1.2031 would allow traders to expect continued growth toward the next Fibonacci level at 261.8% – 1.2172.
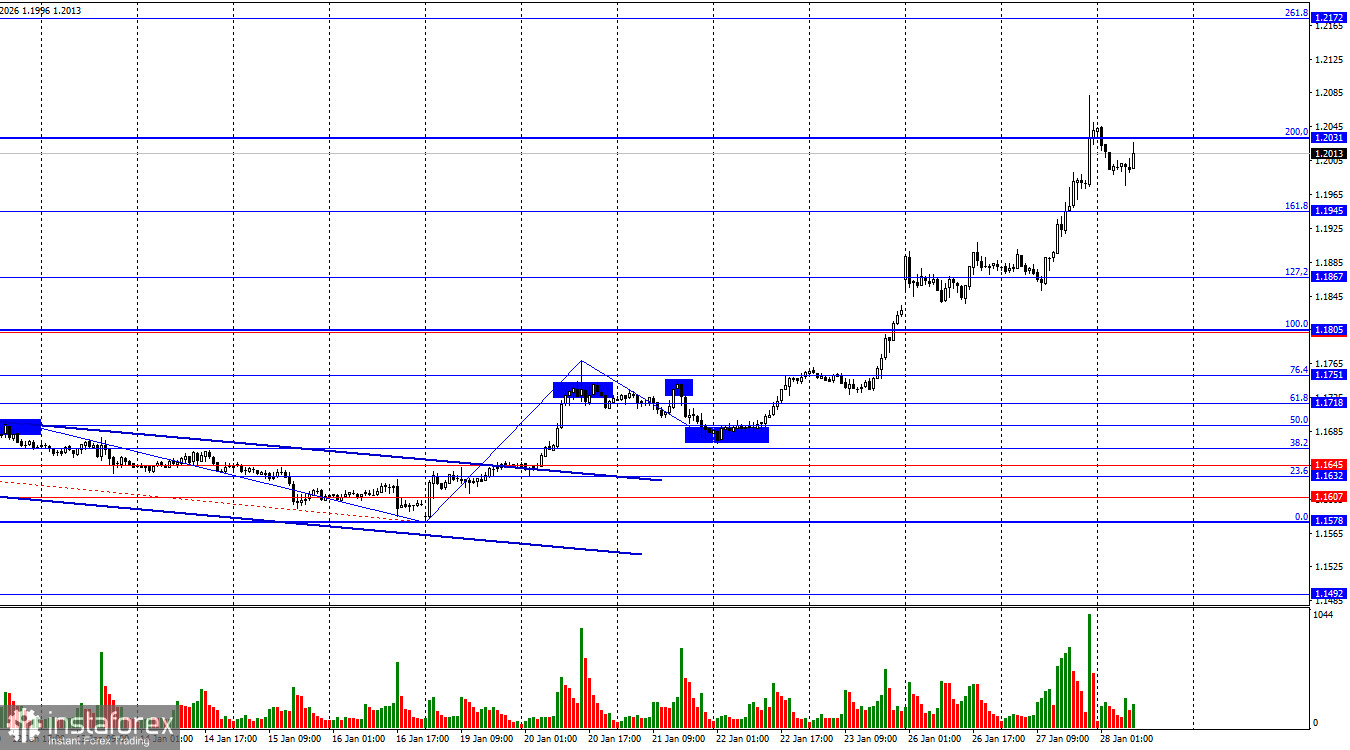
The wave picture on the hourly chart remains straightforward. The most recently completed downward wave did not break the low of the previous wave, while the latest upward wave broke the previous high. Thus, the trend remains bullish. The bulls have launched a new offensive, which might not have happened without Donald Trump. Trump has heated up the global situation to the limit, and markets continue to react by fleeing the risky US currency amid uncertain economic prospects.
On Tuesday, the US dollar could only dream of rising. No sooner had traders priced in the announcement of new tariffs for South Korea and Canada and digested the situation around Greenland than Trump made another statement that crushed the US currency. Last night, the US president said that a weaker dollar is excellent for the American economy, as it improves the competitiveness of US goods on global markets. When the dollar exchange rate falls, the dollar itself becomes cheaper while other currencies appreciate. As a result, products from US companies become cheaper for foreign consumers and export volumes increase—at least in theory. In practice, we will see how US exports perform. I would like to remind readers that many consumers and even entire countries have imposed an unofficial boycott on Trump and US goods in response to his protectionist policies and trade tariffs. Therefore, for Trump's scheme to work, US goods must not only become cheaper, but must actually be purchased.
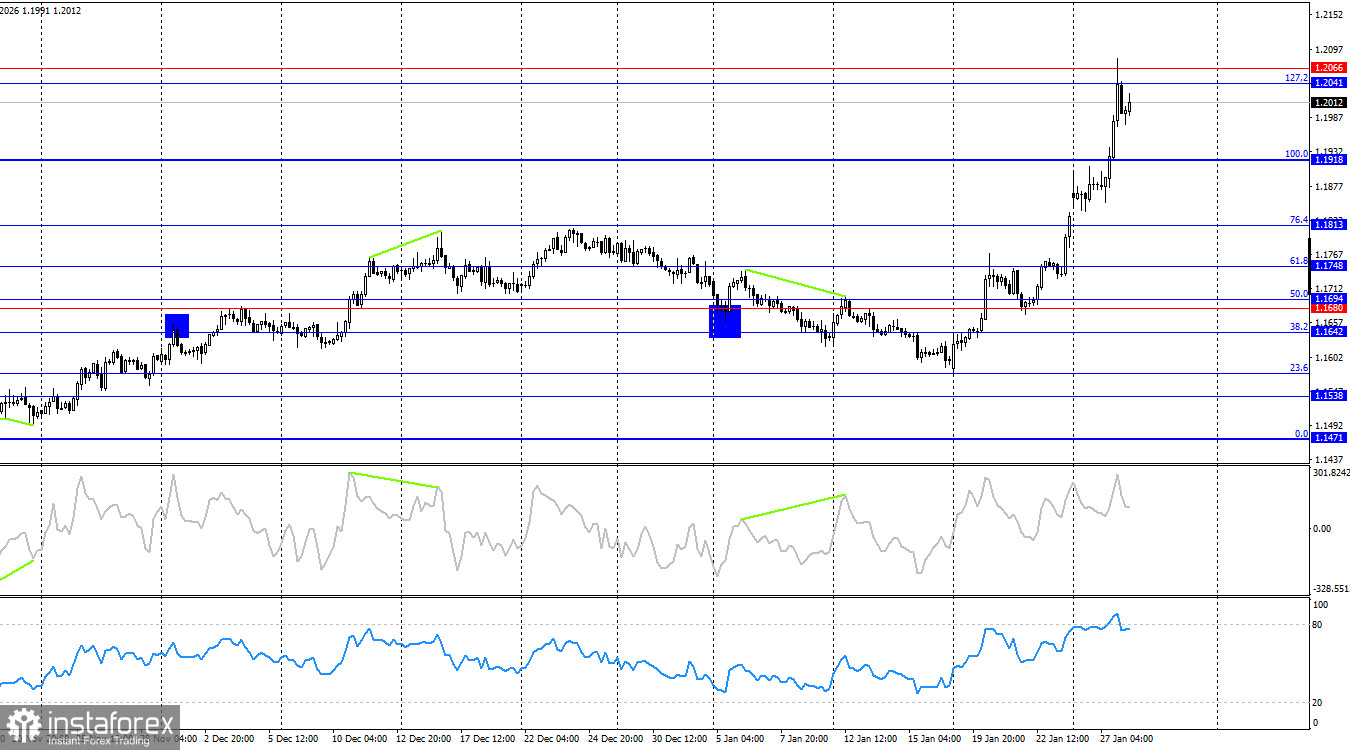
On the 4-hour chart, the pair rose into the resistance level of 1.2041–1.2066. A rebound from this zone would favor the US currency and lead to a moderate decline toward the Fibonacci 100.0% level at 1.1918. A consolidation above the 1.2041–1.2066 level would increase the probability of continued growth toward the 161.8% level at 1.2196. No emerging divergences are observed on any indicators today.
Commitments of Traders (COT) Report:
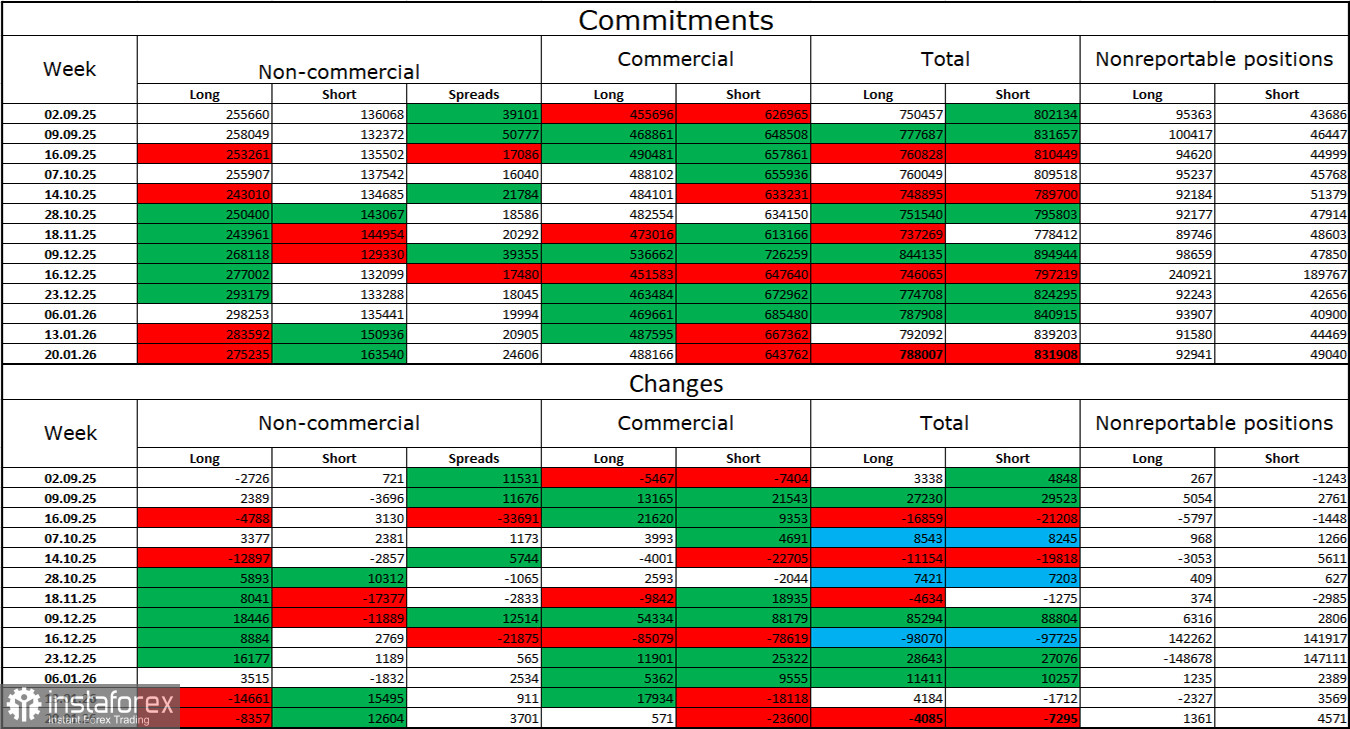
During the latest reporting week, professional market participants closed 8,357 long positions and opened 12,604 short positions. Sentiment among the "Non-commercial" group remains bullish thanks to Donald Trump and his policies, and continues to strengthen over time. The total number of long positions held by speculators now stands at 275,000, while short positions total 163,000—almost a twofold advantage for the bulls.
For thirty-three consecutive weeks, large players were reducing short positions and increasing long ones. Then the shutdown began, and now we see the same picture again: professional traders continue to build long positions. Donald Trump's policies remain the most significant factor for traders, as they generate numerous problems that will have long-term and structural consequences for the US. These include deterioration in the labor market. Traders fear a loss of the Fed's independence in 2026 and Donald Trump's geopolitical ambitions.
Economic Calendar for the US and the Eurozone:
The economic calendar for January 28 contains three events, two of which are important. The impact of the news background on market sentiment on Wednesday may be strong.
EUR/USD Forecast and Trading Recommendations:
Selling the pair is possible today if there is a rebound from the 1.2031 level on the hourly chart, with targets at 1.1945 and 1.1867. Buying opportunities were previously available on a rebound from the 1.1686 level on the hourly chart with targets at 1.1731, 1.1802, 1.1945, and 1.2031. All targets were reached. New buying opportunities were available after a close above 1.2031 with a target at 1.2172.
Fibonacci grids are drawn from 1.1805–1.1578 on the hourly chart and from 1.1918–1.1471 on the 4-hour chart.
¡Los informes analíticos de InstaForex lo mantendrá bien informado de las tendencias del mercado! Al ser un cliente de InstaForex, se le proporciona una gran cantidad de servicios gratuitos para una operación eficiente.


