 Permanecer
Condiciones de negociación
Products
Herramientas


Bitcoin has been pondering its next movement for several days. At the moment, "digital gold" is much closer to resuming its decline than starting a noticeable correction. The only pattern supporting the corrective movement at this time is a "bullish" IFVG on the 4-hour timeframe. However, over the past few days, we have not seen a reaction to this pattern. Thus, it may soon be invalidated, leaving Bitcoin without any supporting factors, even technically.
Some traders currently expect that the US labor market will continue to show weakness, which would compel the Fed to resume monetary easing. A decrease in the key interest rate is, in theory, supportive of risk assets. However, we have stated before that the idea of easing was already factored into the market back in October 2022, when US inflation began to slow from its peak. It was during this period that Bitcoin formed another upward trend. Right now, we are witnessing a downward trend that is just 5 months old. We believe it will last for at least a year.
Many retail traders are also predicting further declines for the world's first cryptocurrency. Unlike various funds, banks, and so-called "crypto-experts," who always anticipate growth. For example, traders note that the price is significantly below the 50-week exponential moving average. There's also the test of the 200-week moving average, which previously led to further price declines. Currently, only Kathy Wood, Michael Saylor, and other experts who depend on their investments believe in Bitcoin's recent rise. Not only do they believe, but they also urge everyone to buy "digital gold" immediately.
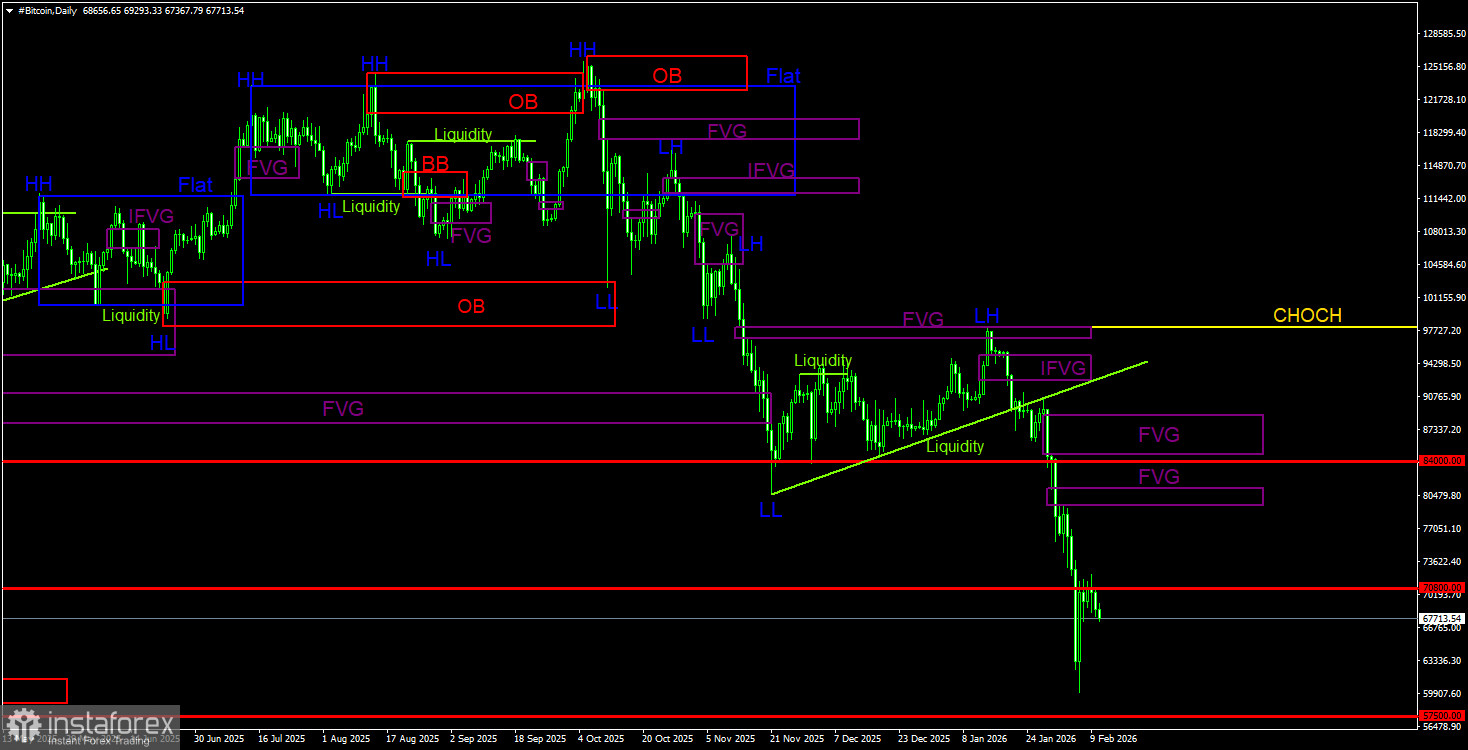
On the daily timeframe, Bitcoin continues to form a downward trend. The trend is bearish, and the CHOCH line currently sits at $97,900. Only above this level can we consider the downward trend to be finished. "In 2026, Bitcoin could fall to $60,000." We mentioned this just a week ago. Bitcoin reached $60,000 in just a few days... Recall that a sell signal was formed within the "bearish" FVG ($96,900 – $98,000) and received confirmation. Thus, traders could capture almost the entire latest movement. The current target remains the $57,500 level—corresponding to the 61.8% Fibonacci. On the daily timeframe, the nearest area of interest (POI) for selling is between $79,500 and $81,100.
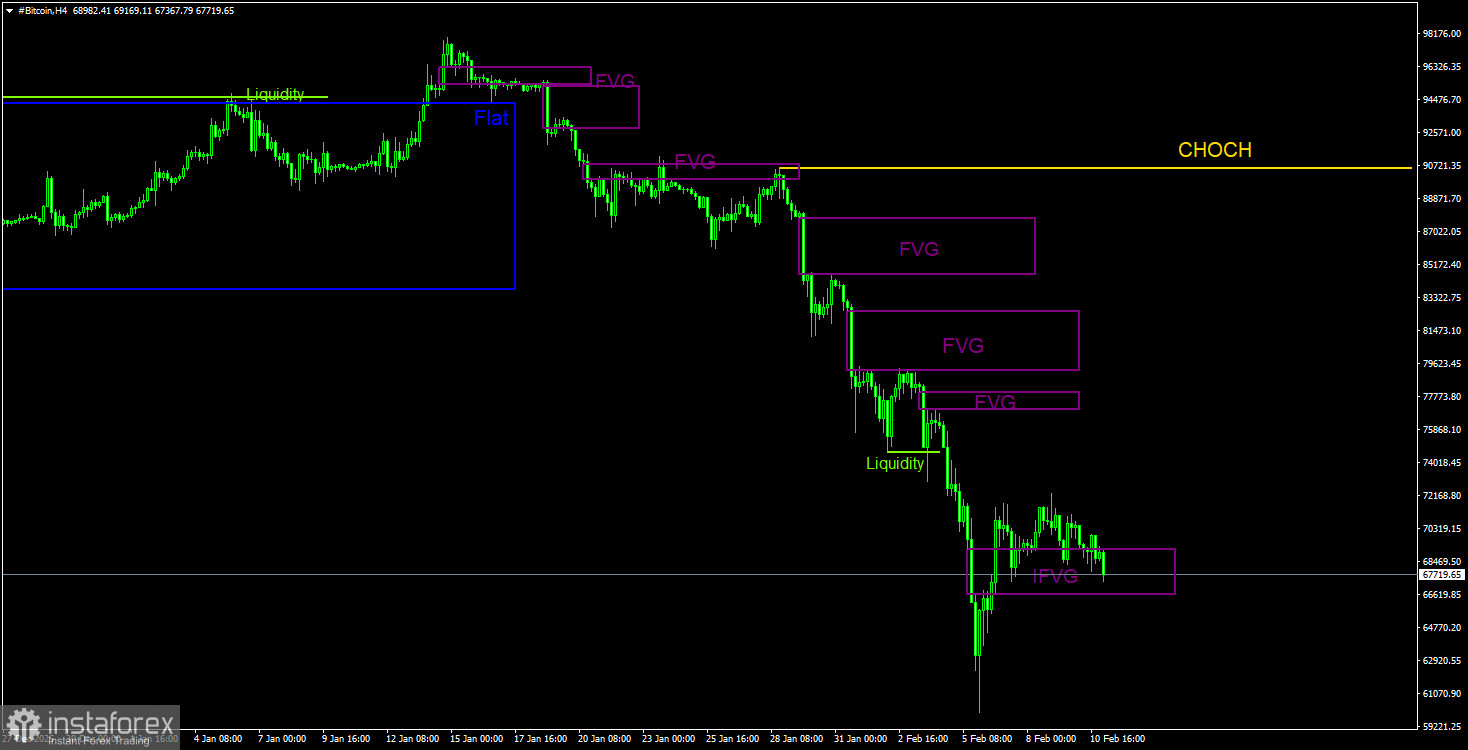
On the 4-hour timeframe, the price continues to form a downward structure. The CHOCH line runs at $90,560; only above this level can we speak of a trend transformation upward. However, at the moment, there are no signs that Bitcoin could end its decline anytime soon. Even the "bullish" IFVG is not producing any noticeable reaction. Thus, even corrective growth is currently out of Bitcoin's reach. In the best-case scenario, it may enter a flat phase.
Bitcoin continues to form a solid downward trend. We continue to expect declines, targeting $57,500 (the 61.8% level from a three-year upward trend), and there are currently no signs of a trend reversal. However, even the $57,500 level no longer appears as a final stop. Among the areas of interest for selling on the daily timeframe, the last "bearish" FVG can be noted, which Bitcoin is still far from reaching. The decline may resume without the need to work through the nearest POI area.
¡Los informes analíticos de InstaForex lo mantendrá bien informado de las tendencias del mercado! Al ser un cliente de InstaForex, se le proporciona una gran cantidad de servicios gratuitos para una operación eficiente.


