empty
 
 
Está a punto de salir de
www.instaforex.eu >
un sitio web operado por
INSTANT TRADING EU LTD
Abrir cuenta

16.02.202607:25 Forex Analysis & Reviews: How to Trade the GBP/USD Currency Pair on February 16? Simple Tips and Analysis for Beginners

Esta información se proporciona a clientes minoristas y profesionales como parte de comunicación de marketing. No contiene y no debe interpretarse como asesoramiento o recomendación de inversión o una oferta o solicitud para participar en cualquier transacción o estrategia en instrumentos financieros. El desempeño pasado no garantiza o predice el desempeño futuro. Instant Trading EU Ltd. no asume ninguna representación ni responsabilidad sobre la precisión o integridad de la información proporcionada, o cualquier pérdida que surja de cualquier inversión basada en el análisis, pronóstico u otra información proporcionada por un empleado de la Compañía o de otra manera. El descargo de responsabilidad completo está disponible aquí.

Trade Analysis for Friday:

1H Chart of the GBP/USD Pair

Exchange Rates 16.02.2026 analysis

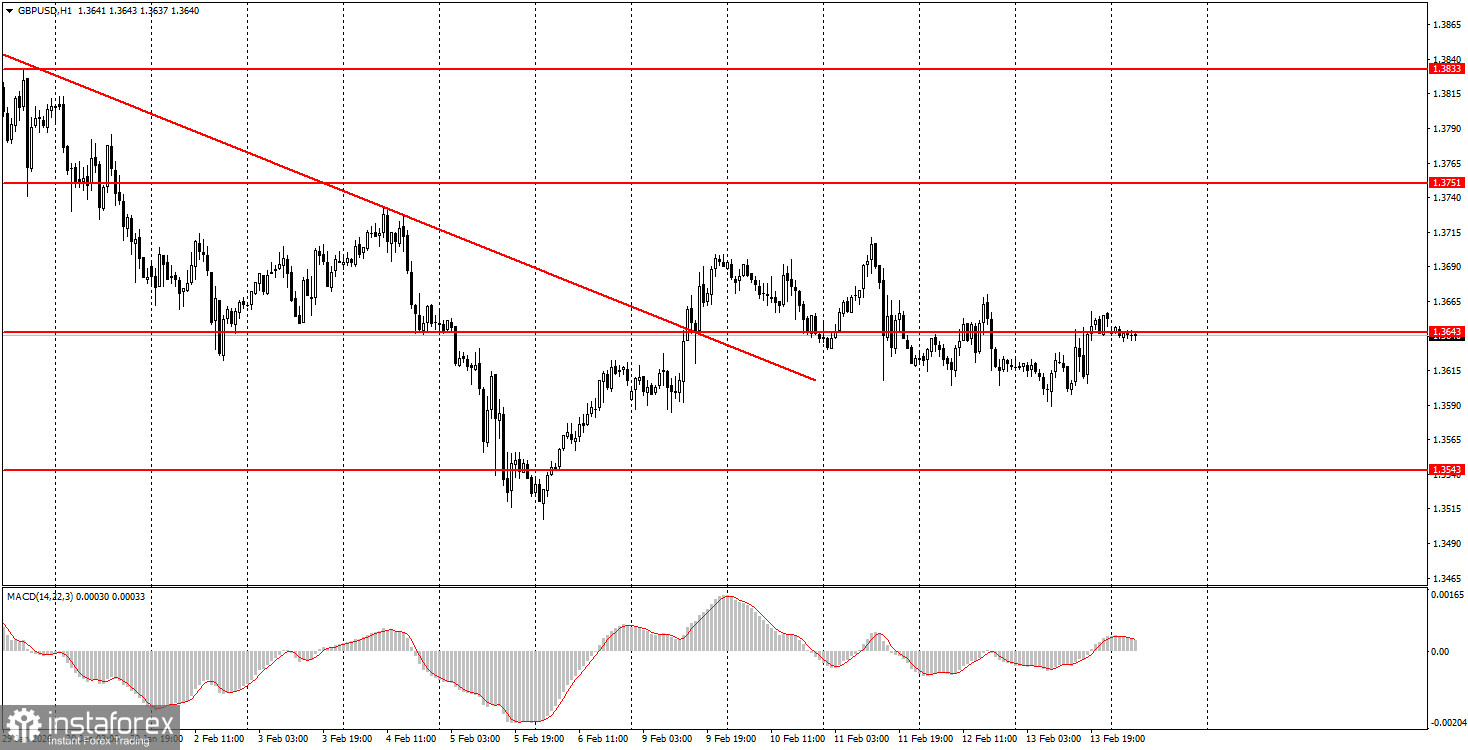
The GBP/USD pair also traded with low volatility on Friday, mostly sideways. Overall, after breaking the descending trend line, we did not observe any interesting movements. The British pound is gradually sliding, even though the trend has turned upward, and there are still no substantial reasons for the U.S. dollar to rise. We believe that the macroeconomic data from across the pond last week should have triggered a new wave of dollar decline, as the likelihood of a new cut in the Federal Reserve's key rate increased following the inflation report. Additionally, we cannot be entirely confident in the recovery of the labor market, as only 180,000 jobs were created in 2025, a meager figure for the American economy. Thus, we assess the U.S. macroeconomic data package as negative. British data also "fell short," but the market primarily focuses on U.S. data.

5M Chart of the GBP/USD Pair

Exchange Rates 16.02.2026 analysis

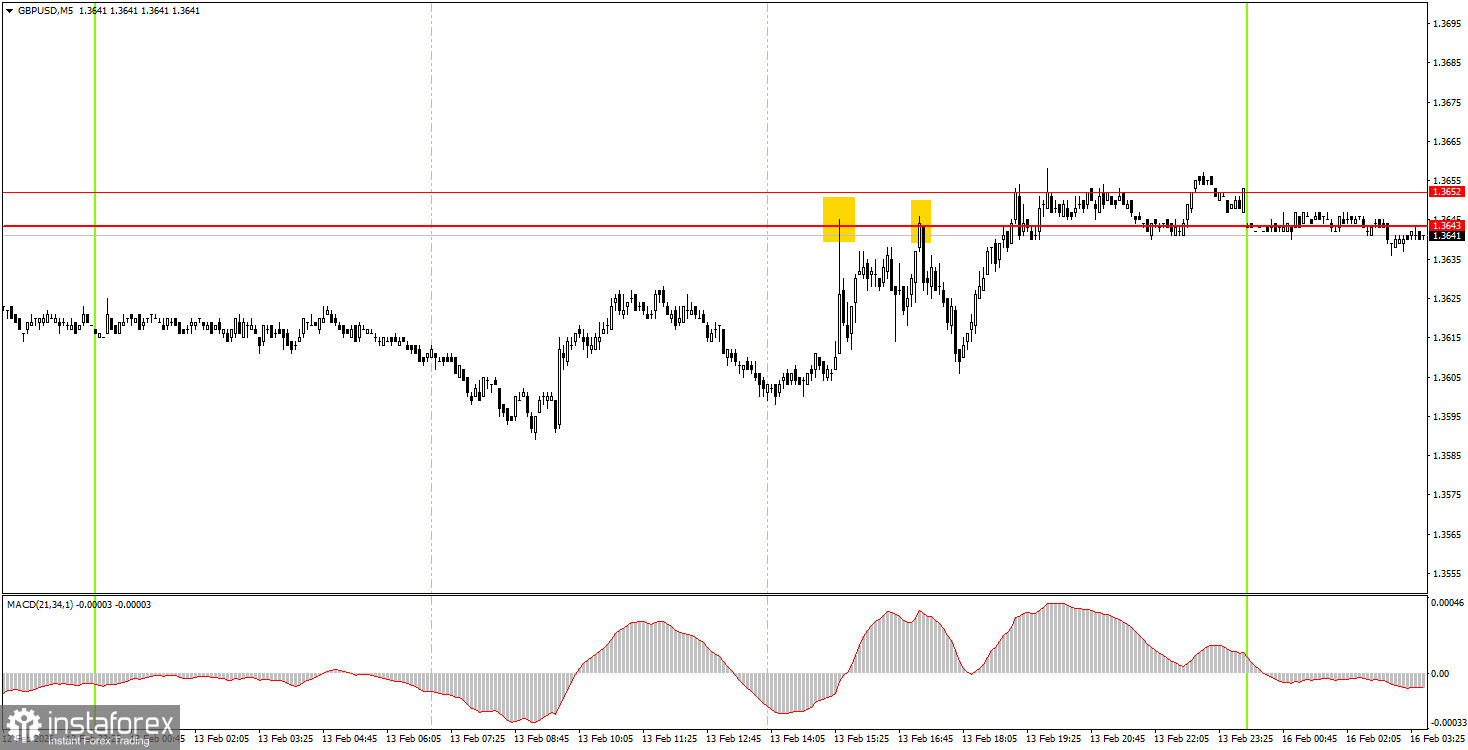
On the 5-minute timeframe on Friday, two trading signals were formed. The price bounced off the 1.3643-1.3652 range twice but only moved in the desired direction by 20 pips. This was enough to set a Stop Loss to breakeven, at which point the trade was closed. The signals duplicated each other.

How to Trade on Monday:

On the hourly timeframe, the GBP/USD pair has broken the downward trend. There are no global grounds for medium-term growth of the dollar, so we expect the continuation of the global upward trend from 2025, which could lead the pair to the 1.4000 mark, at least. In recent weeks, the situation has often not been favorable for the British currency, and the market, after a few active weeks, is again entering a state of stagnation.

On Monday, beginner traders may consider short positions if the pair bounces from the area of 1.3643-1.3652 with a target of 1.3529-1.3543. Consolidation above the area of 1.3643-1.3652 would allow for the opening of long positions with a target of 1.3741-1.3751.

On the 5-minute timeframe, levels to trade are now 1.3319-1.3331, 1.3365, 1.3403-1.3407, 1.3437-1.3446, 1.3484-1.3489, 1.3529-1.3543, 1.3643-1.3652, 1.3741-1.3751, 1.3814-1.3832, 1.3891-1.3912, 1.3975. On Monday, there are no important events scheduled in the UK or the U.S. Thus, traders will have nothing to react to throughout the day. We expect a "boring Monday."

Main Rules of the Trading System:

  1. The strength of the signal is determined by the time it takes to form (rebound or breaking through the level). The shorter the time, the stronger the signal.
  2. If two or more trades were opened around a particular level based on false signals, all subsequent signals from that level should be ignored.
  3. In a flat market, any pair can generate numerous false signals or no signals at all. In any case, it is best to stop trading at the first signs of a flat.
  4. Trades are opened during the time period between the start of the European session and until the middle of the American session, after which all trades should be manually closed.
  5. On the hourly timeframe, signals from the MACD indicator should ideally be traded only when there is good volatility and a trend confirmed by a trend line or channel.
  6. If two levels are too close to each other (ranging from 5 to 20 pips), they should be considered as a support or resistance area.
  7. After moving 20 pips in the correct direction, it is advisable to set the Stop Loss to break-even.

What's on the Charts:

  • Support and resistance levels are targets for opening buy or sell trades. Take Profit levels can be placed around them.
  • Red lines indicate channels or trend lines that reflect the current trend and indicate the preferred direction for trading now.
  • The MACD indicator (14,22,3) – the histogram and signal line – serves as a supplementary indicator that can also be used as a source of signals.
  • Important speeches and reports (always found in the news calendar) can significantly influence the movement of the currency pair. Therefore, during their release, trading should be conducted with maximum caution, or it is advised to exit the market to avoid a sharp price reversal against the preceding movement.
  • Beginners trading in the Forex market should remember that not every trade can be profitable. Developing a clear strategy and practicing sound money management are the keys to long-term trading success.
Desarrollado por un Paolo Greco
experto de análisis de InstaForex
© 2007-2026

Abra una cuenta de operaciones

¡Los informes analíticos de InstaForex lo mantendrá bien informado de las tendencias del mercado! Al ser un cliente de InstaForex, se le proporciona una gran cantidad de servicios gratuitos para una operación eficiente.


Usted está ahora saliendo de www.instaforex.eu, un sitio web operado por INSTANT TRADING EU LTD
¿No puede hablar ahora mismo?
Ingrese su pregunta en el chat.
Widget callback

Turn "Do Not Track" off