 Permanecer
Condiciones de negociación
Products
Herramientas


EUR/USD
Analysis:
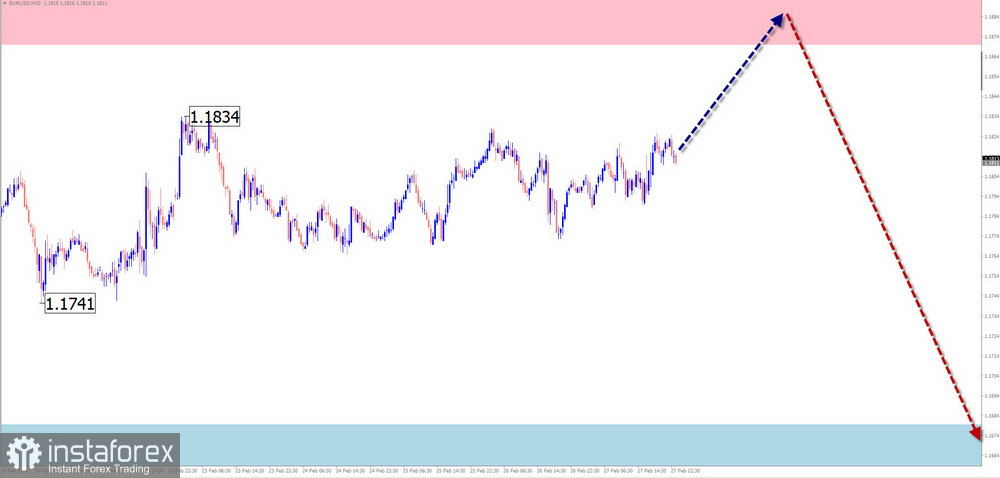
On the chart of the main European currency pair, a downward zigzag wave has been developing since the end of January this year. This wave has clear reversal potential, initiating a correction within a larger wave structure. Quotes are currently within the boundaries of a potential weekly reversal zone.
Forecast:
In the first half of the upcoming week, a slight upward vector is expected, with price rising to the lower boundary of resistance. After that, a change in direction is likely, with price declining toward the support zone.
Potential Reversal Zones
Resistance:
Support:
Recommendations:
Buy positions: possible with reduced volume size within individual trading sessions.Sell positions: may be considered from the resistance zone after appropriate reversal signals appear.
USD/JPY
Analysis:
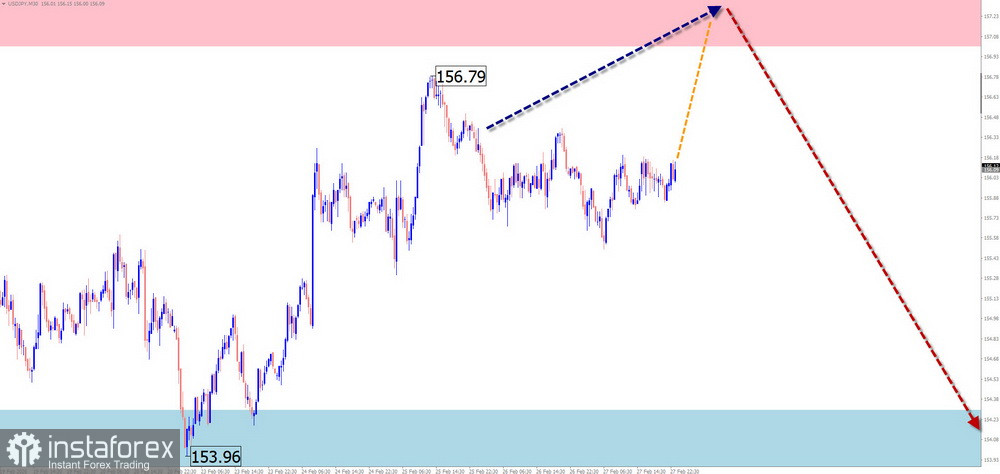
On the chart of the main Japanese yen pair, an upward wave has continued forming in a sideways plane since the end of January. At the time of analysis, price is near the lower boundary of a strong resistance zone. The wave structure does not appear complete; the middle segment (B) is currently forming.
Forecast:
Throughout the upcoming week, the current sideways movement is expected to continue, with price rising toward calculated resistance levels. By the end of the week, the probability of a reversal and the beginning of downward movement increases. During a direction change, pressure and a brief breakout above resistance are possible.
Potential Reversal Zones
Resistance:
Support:
Recommendations:
Sell positions: relevant only after confirmed trend-change signals appear near resistance according to your trading system.Buy positions: possible with fractional volumes intraday. Potential is limited by resistance.
GBP/JPY
Analysis:
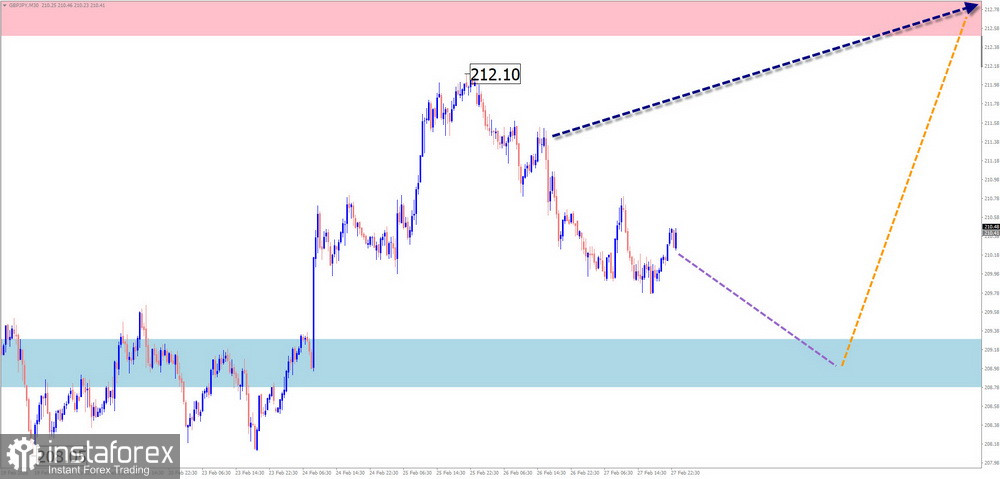
Price fluctuations of the pound/yen pair are shaped by an unfinished upward wave that began on January 26 of this year. Price is forming the beginning of a new wave in line with the main trend. The structure is developing one of the "shifting/extended flat" variations.
Forecast:
At the beginning of the week, sideways movement is more likely. A reversal may form near calculated support. Renewed price growth is most probable toward the end of the week.
Potential Reversal Zones
Resistance:
Support:
Recommendations:
Sell positions: limited potential, may be risky for capital.Buy positions: become relevant after appropriate signals appear near the support zone.
USD/CAD
Analysis:
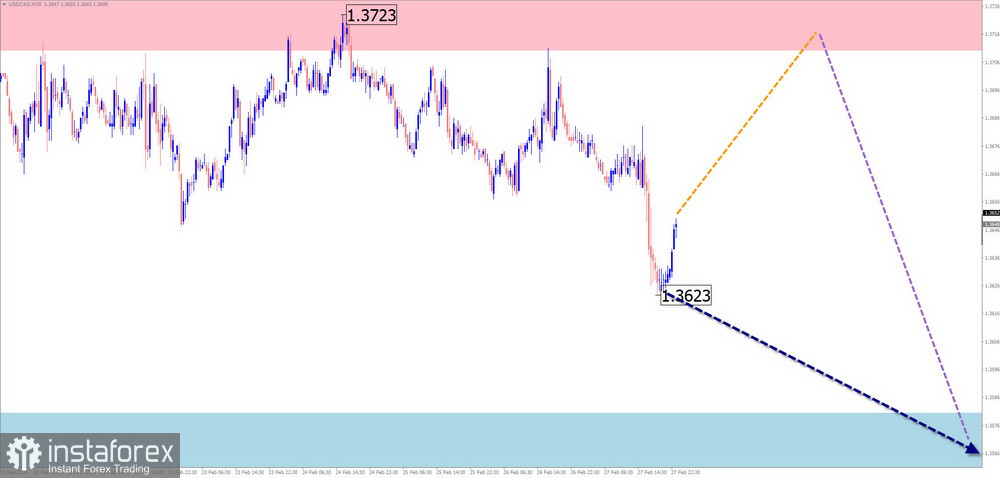
Since the end of January, the Canadian dollar major pair has been forming an upward wave. Within it, the unfinished corrective segment forms a shifting flat. At the time of analysis, the pair is in the middle of the price corridor formed by recent quotes.
Forecast:
During the upcoming week, the upward movement is expected to complete, creating conditions for a reversal and the beginning of a decline. In the next couple of days, sideways movement is the most likely scenario.
Potential Reversal Zones
Resistance:
Support:
Recommendations:
Sell positions: may be unprofitable until clear reversal signals appear near resistance.Buy positions: may be used intraday with fractional volumes. Potential is limited by calculated resistance.
NZD/USD
Analysis:
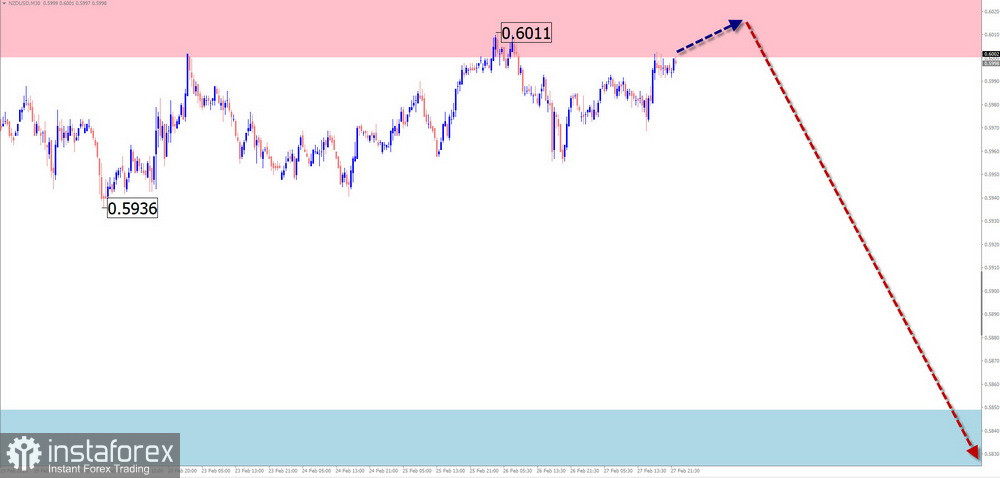
The short-term trend direction since the end of January has been defined by a downward wave. Within its structure, the middle corrective segment (B) is nearing completion. The pair is near calculated resistance within a potential reversal zone. No clear signals of an imminent trend change are visible.
Forecast:
In the coming days, price is likely to continue moving along resistance levels. Within this area, a pause and formation of reversal conditions are possible. A brief breakout above resistance during a direction change cannot be ruled out. Renewed price decline is expected closer to the weekend.
Potential Reversal Zones
Resistance:
Support:
Recommendations:
Buy positions: risky due to limited potential and possible losses.Sell positions: possible after confirmed reversal signals appear near resistance.
Gold
Analysis:
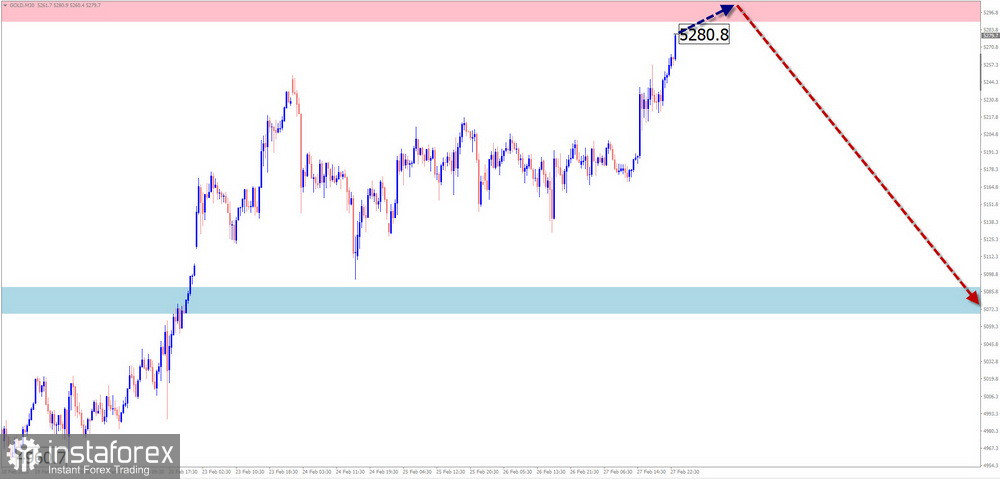
Since reaching historical highs at the end of January, gold prices have been pulling back. The instrument is drifting mostly sideways within a narrow corridor. The currently unfinished corrective wave segment is forming an upward pullback and is close to completion.
Forecast:
In the coming days, price growth and pressure on the upper boundary of resistance are possible, including a brief breakout above it. Afterward, the probability of a sharp reversal and renewed decline increases. An intermediate daily support level lies near the calculated support zone.
Potential Reversal Zones
Resistance:
Support:
Recommendations:
Buy positions: limited potential, may result in losses.Sell positions: may be used only after confirmed reversal signals appear near resistance according to your trading system.
Bitcoin
Analysis:
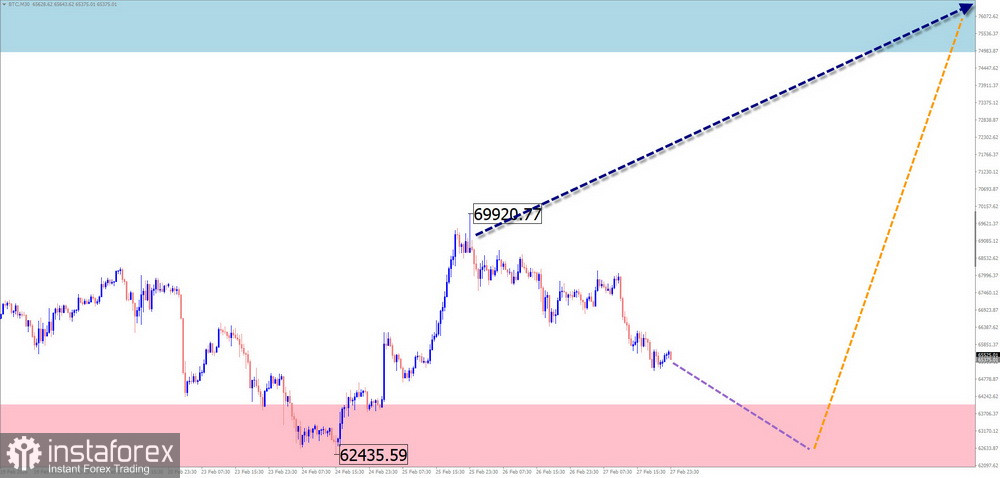
On the Bitcoin chart, an upward wave has been forming since the beginning of last month. Since March 3, the beginning of the final segment (C) has been developing within its structure. In recent weeks, a corrective pullback in the form of a shifting flat has formed within this segment. Its structure is not yet complete.
Forecast:
In the coming days, continued sideways movement with price decline toward calculated support is expected. Afterward, a change in direction is possible. A brief breakout below the lower boundary of the reversal zone during the trend change cannot be ruled out. Increased volatility is expected toward the end of the week, with a high probability of synchronization with the release of important economic data.
Potential Reversal Zones
Resistance:
Support:
Recommendations:
Sell positions: limited potential, risky.Buy positions: may be considered after confirmed signals of trend change appear.
Ripple
Analysis:
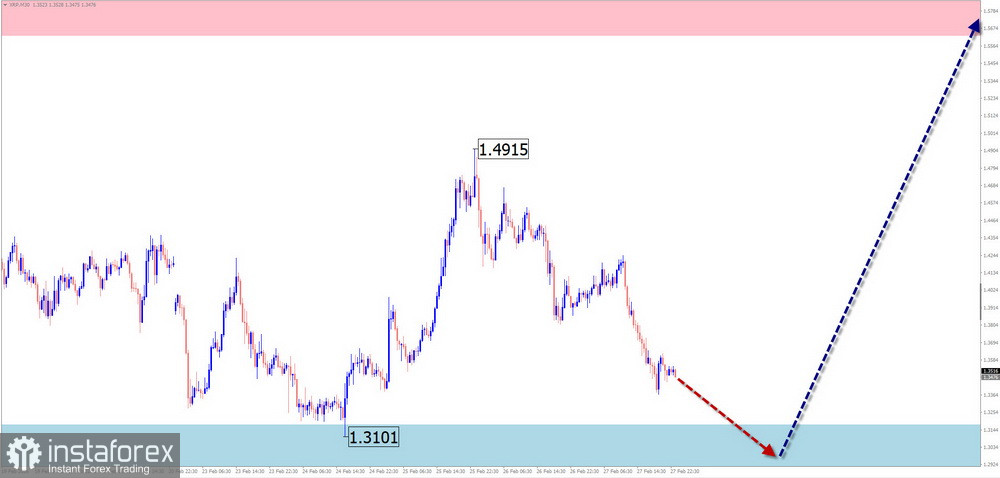
Since the beginning of February, price fluctuations on the Ripple chart have followed an upward wave algorithm. The wave extremes form a "horizontal pennant" pattern. The middle segment of the wave is currently developing and remains unfinished. Quotes are near a potential reversal zone.
Forecast:
At the beginning of the week, continued downward movement is expected. Near calculated support, a pause and transition into sideways drift are likely. Closer to the weekend, a change in direction and return to upward movement can be expected.
Potential Reversal Zones
Resistance:
Support:
Recommendations:
Sell positions: may be used with reduced volume size within individual sessions until the first reversal signals appear.Buy positions: possible after confirmed reversal signals appear near support according to your trading system.
Notes: In simplified wave analysis (SWA), all waves consist of three parts (A–B–C). On each timeframe, the last unfinished wave is analyzed. Dashed lines indicate expected movements.
Attention: The wave algorithm does not take into account the duration of price movements over time.
¡Los informes analíticos de InstaForex lo mantendrá bien informado de las tendencias del mercado! Al ser un cliente de InstaForex, se le proporciona una gran cantidad de servicios gratuitos para una operación eficiente.


