 Permanecer
Condiciones de negociación
Products
Herramientas


Bitcoin still shows little appetite to rise and is trading in a range. Last week we saw prices climb from $63,500 to $74,000, but at the start of the new week, prices fell back to $66,500. The first cryptocurrency is now rising again, which perfectly fits the character of range movements. In the near term, traders can expect a sell signal to form around the upper border of the sideways channel on the 4?hour timeframe. Remember that in a downtrend sell signals have higher priority.
Meanwhile, analysts at Bitfinex said that the rise in oil prices in global markets is holding back Bitcoin's growth. According to the firm's experts, Bitcoin's further dynamics will depend on oil prices, bond yields, and Fed monetary policy. Expensive oil will accelerate inflation worldwide, forcing central banks to abandon further policy easing. Tighter lending conditions lead to lower household savings, increase pressure on the economy and make investors seek safe?haven assets — a category to which Bitcoin clearly does not belong.
It's an interesting correlation from Bitfinex, but it does not quite reflect reality. Bitcoin has been falling for roughly six months, and the oil?price surge caught "digital gold" already inside a sideways channel. Put simply, Bitcoin first lost more than half its value, then entered a flat. Only afterwards, the Iran war flared up, and energy prices embarked on a rapid rally. Thus, at the start of the turmoil in the Middle East, Bitcoin was not in an uptrend. Therefore, the conflict in Iran did not and does not prevent Bitcoin from strengthening. As for Fed monetary policy, the market has been discounting rate cuts for three years. The Federal Reserve has not cut rates as many times as the market has priced that factor in. In our view, there are still no signs that the downtrend has ended.
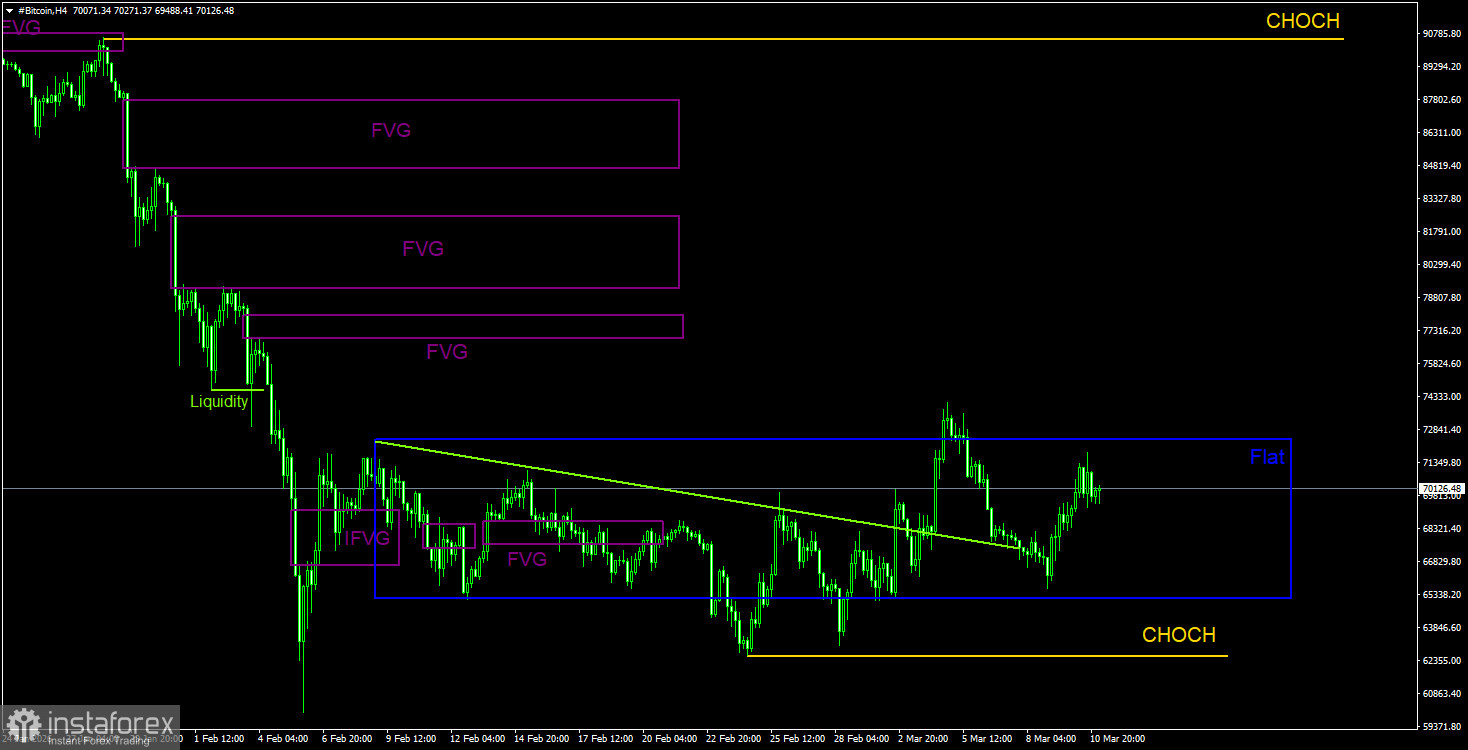
Bitcoin continues to form a full?fledged downtrend. We still expect a decline toward $57,500 (the 61.8% Fibonacci level of the three-year uptrend), and there are currently no signs of a trend reversal. Even $57,500 no longer looks like the final stop. From POI areas, note only the nearest bearish FVG on the daily timeframe, which is located quite far from the current price. On the 4-hour timeframe, we expect a new deviation of the upper channel band in the near term, as the price is currently moving toward it.

A downtrend is still in progress on the daily timeframe. The key sell pattern has been and remains the bearish order block on the weekly timeframe. As we warned, the move triggered by that signal can be strong and prolonged. Since its formation, Ether has already fallen about 55% (roughly $2,500). In the near term, an upside correction is still possible, but the price remains in a fairly narrow sideways channel within the downtrend. Inside the range, trade only from its borders. The most recent sell signal formed as a deviation of the upper band of the sideways channel at $1,892–$2,150, so it was natural that the price fell to the lower band. Now, we expect the formation of new deviations.
CHOCH — change of character / break of the trend structure. Liquidity — liquidity, traders' Stop?Losses that market?makers use to build their positions. FVG — Fair Value Gap (area of price inefficiency). Price often moves quickly through such areas, indicating the absence of one side in the market. Later, the price tends to return and react to these zones. IFVG — Inverted Fair Value Gap. After a return to such a zone, the price does not react but impulsively breaks through and then tests it from the other side.
OB — Order Block. A candle on which a market?maker opened a position in order to harvest liquidity and then form their own position in the opposite direction.
¡Los informes analíticos de InstaForex lo mantendrá bien informado de las tendencias del mercado! Al ser un cliente de InstaForex, se le proporciona una gran cantidad de servicios gratuitos para una operación eficiente.


