 Permanecer
Condiciones de negociación
Products
Herramientas


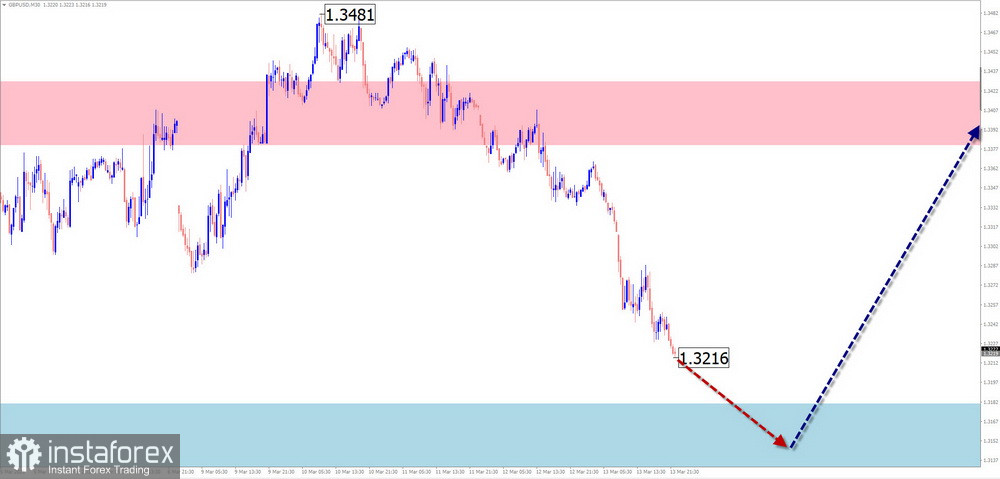
On the chart of the British pound major pair, a short-term bearish wave has been forming since the end of January this year. Analysis of its structure does not indicate completion yet. After breaking through the previous resistance, the price is located near the upper boundary, forming an intermediate correction. The correction structure is not finished at the time of analysis.
In the coming days, the British pound is expected to continue moving sideways. A downward move with pressure on the support zone is possible. In the second half of the week, the probability of a change in direction increases, with the pair potentially rising toward the resistance zone. A brief breakout below the calculated support boundary during the change of direction cannot be ruled out.
Resistance:
Support:
Selling: limited potential; trading is risky.
Buying: will become relevant after confirmed signals appear near the support zone.
AUD/USD
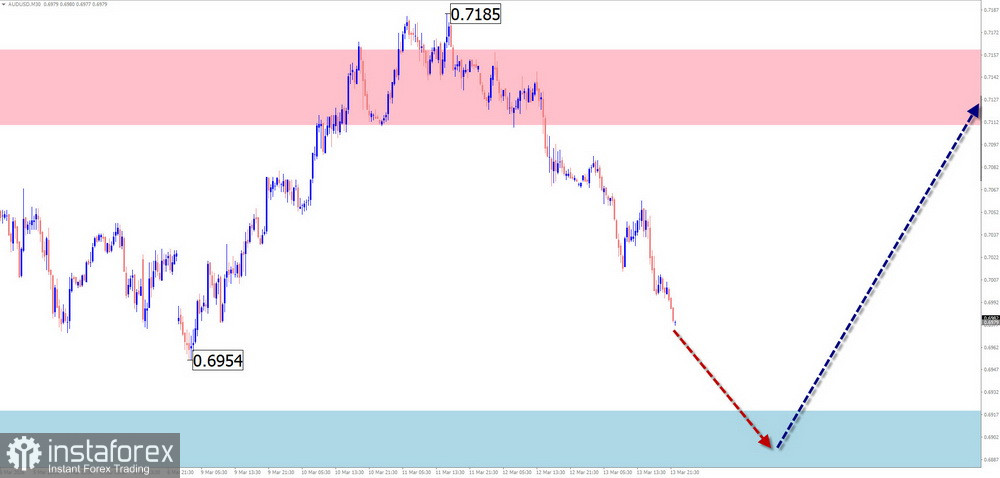
An unfinished bullish wave on the Australian dollar chart, developing since September last year, defines the main direction of the pair. Price extremes form a pennant pattern on the chart. Wave structure analysis shows a corrective pullback forming within the final segment (C). No signs of an imminent reversal are observed.
In the coming days, the pair is expected to continue its overall sideways movement. A brief decline toward the calculated support is possible. Toward the end of the week, the probability of a change in direction and renewed price growth increases. Weekly growth potential is limited by resistance.
Resistance:
Support:
Buying: conditions will not appear until confirmed reversal signals emerge near the calculated support.
Selling: has limited potential. It is safer to reduce position size and limit trades to session timeframes.
USD/CHF
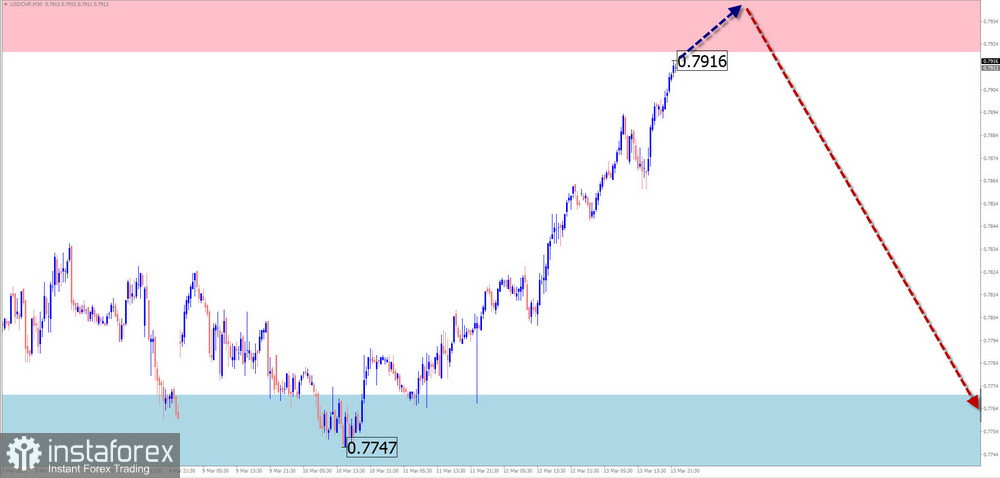
In the short term, price movement is defined by the algorithm of an unfinished bullish wave that started on April 11 last year. Since the end of January this year, the quotes have begun forming the final segment (C). The price has reached the boundaries of a broad weekly potential reversal zone.
In the coming days, the upward price movement is expected to complete, gradually transitioning into sideways movement along the resistance zone. By the end of the week, a reversal may form and a decline toward the calculated support area may begin.
Resistance:
Support:
Buying: no potential, high risk.
Selling: may become possible after confirmed reversal signals appear near the calculated resistance.
EUR/JPY
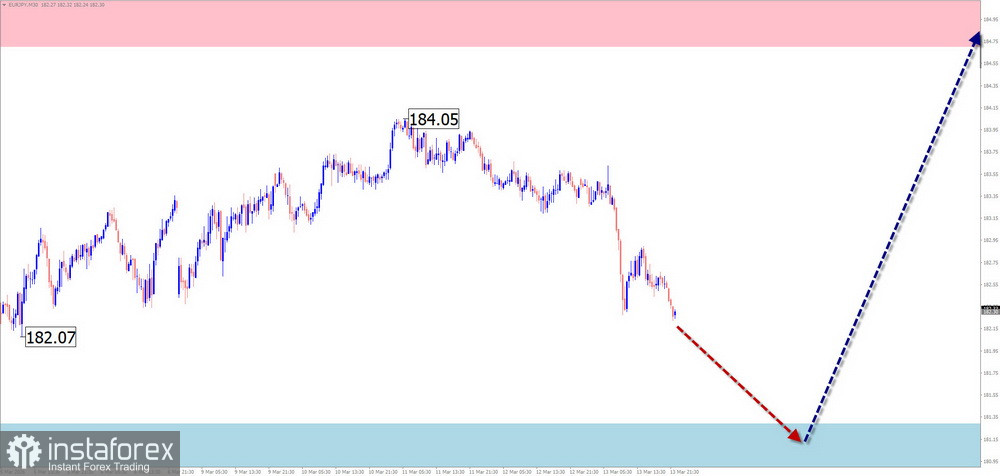
A short-term upward trend has been forming in the euro/yen pair since the end of January. Since early March, the unfinished segment of the wave has been forming a corrective section (B). The price is moving toward the upper boundary of strong weekly resistance.
During the coming week, sideways movement is likely to continue. In the next couple of days, a short-term pullback downward is more likely. In the second half of the week, a reversal near support and renewed price growth are expected. The growth may continue up to the resistance zone.
Resistance:
Support:
Buying: conditions will arise after reversal signals appear near the support zone.
Selling: possible during individual sessions with reduced position sizes; downward potential is limited by support.
Ethereum
Since mid-January this year, Ethereum's short-term movements have been defined by a downward trend. The unfinished corrective section of the wave started on February 6. After breaking an intermediate support level, the price has been moving sideways. After this phase ends, the formation of the downward wave is expected to continue.
During the upcoming week, the price is expected to remain generally flat. In the coming days, sideways movement is more likely, although a short-term upward move cannot be ruled out. Near the resistance zone, a reversal may form, followed by renewed decline toward the support zone.
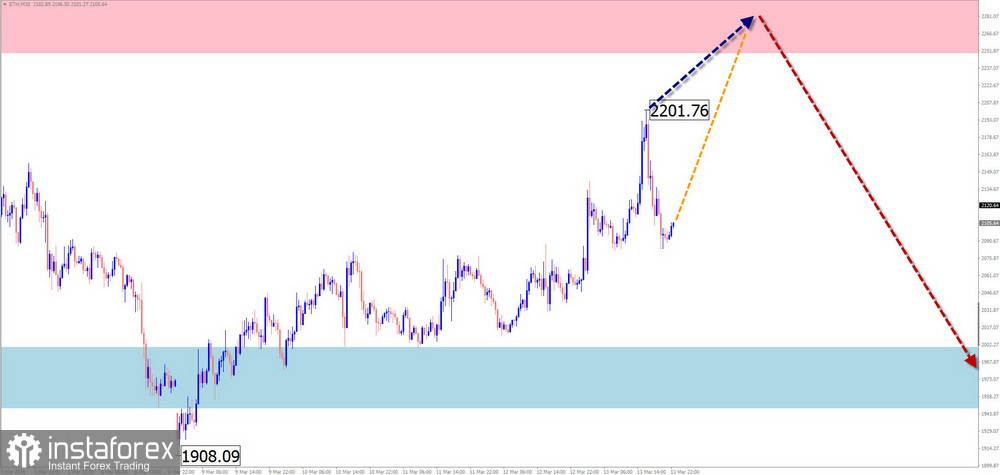
Resistance:
Support:
Buying: possible with smaller position sizes during individual trading sessions; potential is limited by resistance.
Selling: may be used after confirmed reversal signals appear near the resistance zone.
Litecoin
Litecoin quotations have been forming a downward wave since October last year. Over the past month, the price has been forming a correction in the shape of an expanded flat pattern. At present, the wave does not appear to be complete. The price is within a strong daily potential reversal zone.
In the coming days, a gradual rise toward the calculated resistance levels is expected. Short-term pressure on the upper boundary cannot be ruled out. After that, a reversal and change in direction may occur. The calculated support area represents the most likely zone for the weekly decline of this cryptocurrency.
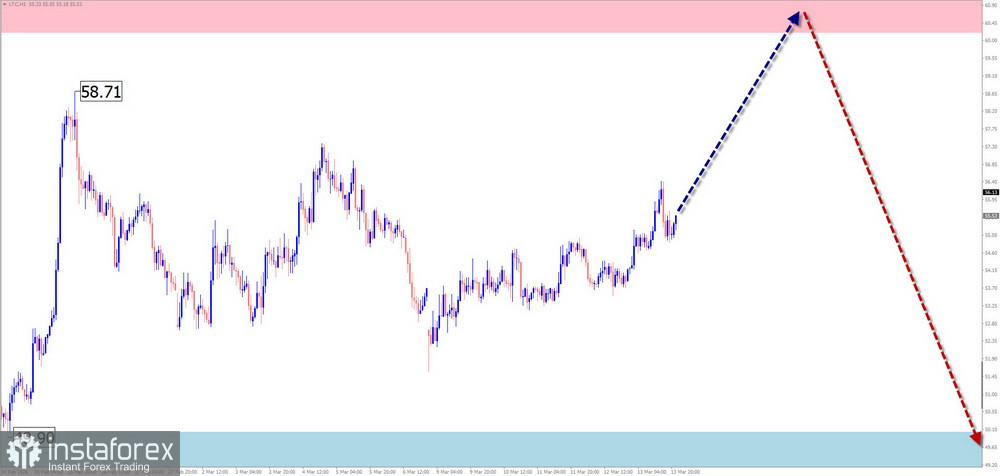
Resistance:
Support:
Buying: limited potential.
Selling: will become possible after corresponding signals appear near resistance according to your trading systems.
Notes: In Simplified Wave Analysis (SWA), all waves consist of three parts: A–B–C. On each timeframe, the most recent unfinished wave is analyzed. Dashed lines show the expected movements.
Attention: The wave algorithm does not account for the time duration of price movements.
¡Los informes analíticos de InstaForex lo mantendrá bien informado de las tendencias del mercado! Al ser un cliente de InstaForex, se le proporciona una gran cantidad de servicios gratuitos para una operación eficiente.


