 Permanecer
Condiciones de negociación
Products
Herramientas


GBP/USD
Analysis:
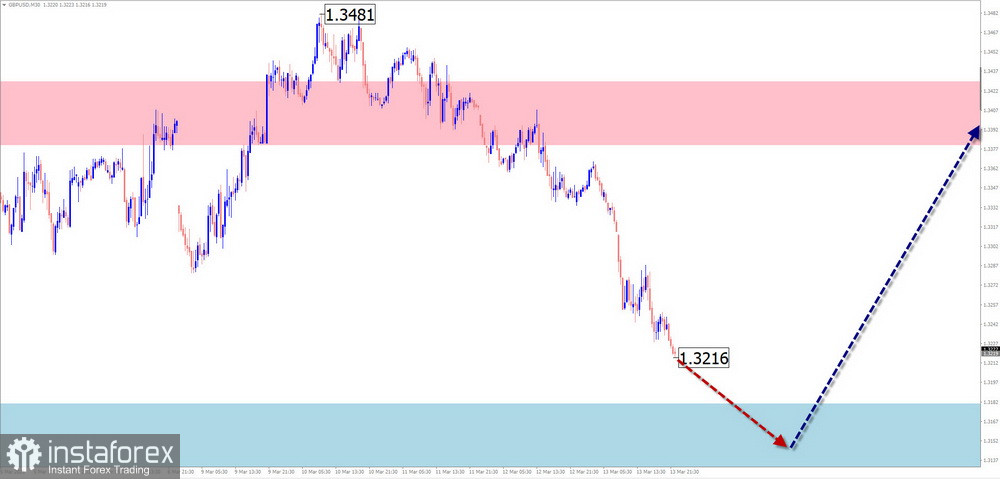
Short-term analysis of the British pound major pair shows that the downward wave model starting from January 27 of this year is not yet complete. In recent weeks, the middle part (B) of the wave has been developing. Quotes are forming a shifting flat pattern that is not yet complete at the time of analysis.
Forecast:
In the coming days, sideways movement is expected. A short-term rise toward resistance is possible. Then a pause and formation of reversal conditions may occur. A renewed upward movement is more likely closer to the weekend.
Potential Reversal Zones
Resistance:
Support:
Recommendations:
AUD/USD
Analysis:
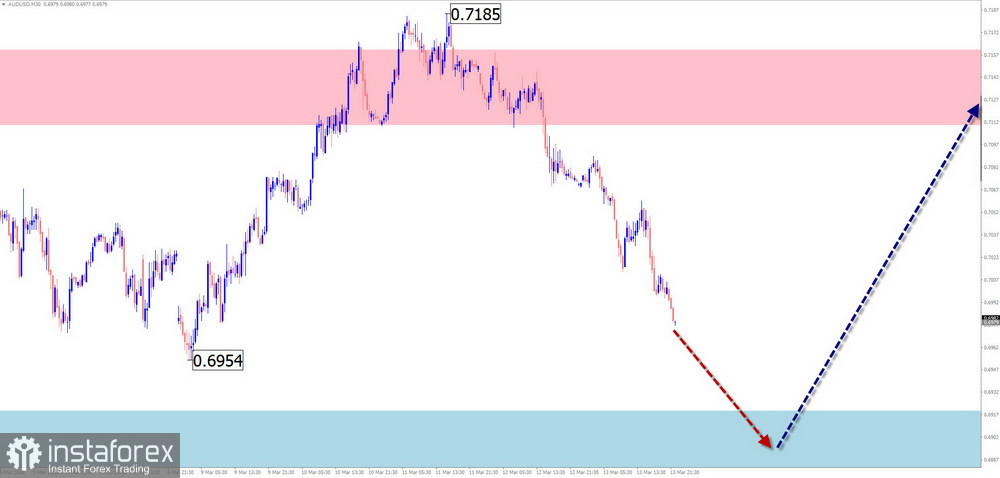
The downward wave that started at the end of January continues to develop. The entire structure is forming as an extended flat and is still incomplete. About ten days ago, the final part (C) of the wave began forming.
Forecast:
Over the next couple of days, continued downward movement toward support is expected. Closer to the weekend, increased volatility, a change in direction, and the start of an upward move are likely.
Potential Reversal Zones
Resistance:
Support:
Recommendations:
USD/CHF
Analysis:
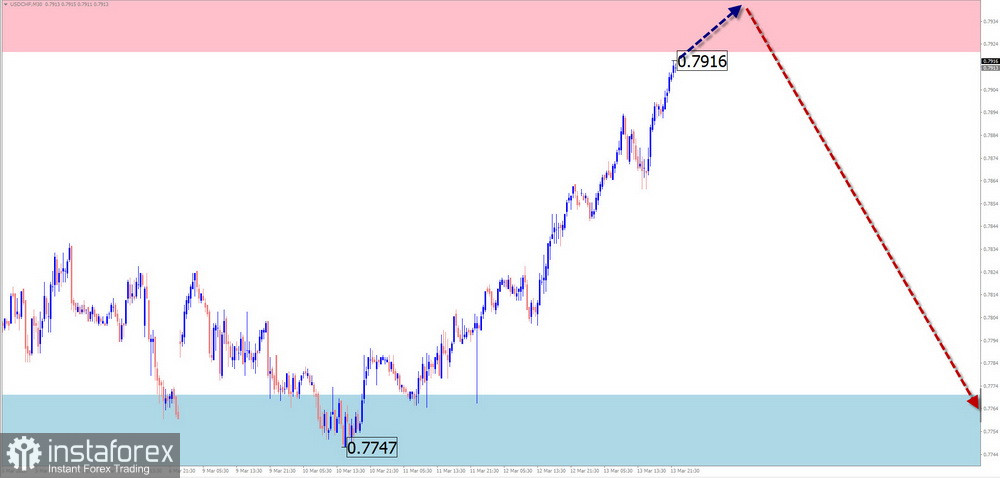
Analysis of the upward wave since late January shows that the corrective part (B) is not yet complete. Its structure forms an extended flat. At the time of analysis, the final segment is still missing. Before the uptrend resumes, the correction must be completed.
Forecast:
In the coming days, sideways movement with a slight upward bias is expected. Growth is unlikely to exceed the resistance zone. Toward the weekend, volatility may increase, with a possible reversal and downward movement. The lower boundary is defined by support.
Potential Reversal Zones
Resistance:
Support:
Recommendations:
EUR/JPY
Analysis:
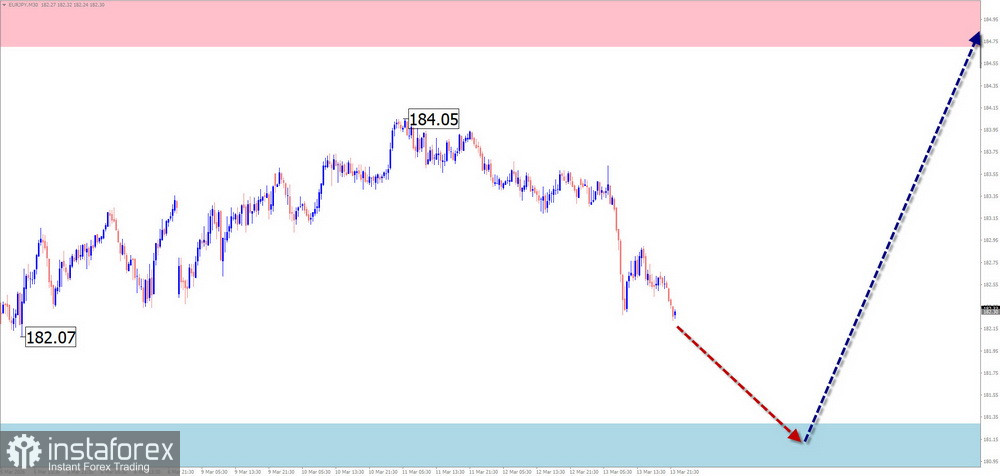
The unfinished segment of the short-term bullish trend has been developing since the end of February. Since the beginning of this month, prices have been forming a counter correction within a sideways range. This structure is not yet complete. Price is moving within a flat channel between reversal zones of different scales.
Forecast:
Over the coming week, the pair is expected to move between opposing zones. An upward move is more likely at first. Toward the end of the week, the probability of a reversal and downward movement increases. A brief breakout above resistance cannot be ruled out.
Potential Reversal Zones
Resistance:
Support:
Recommendations:
Ethereum
Analysis:
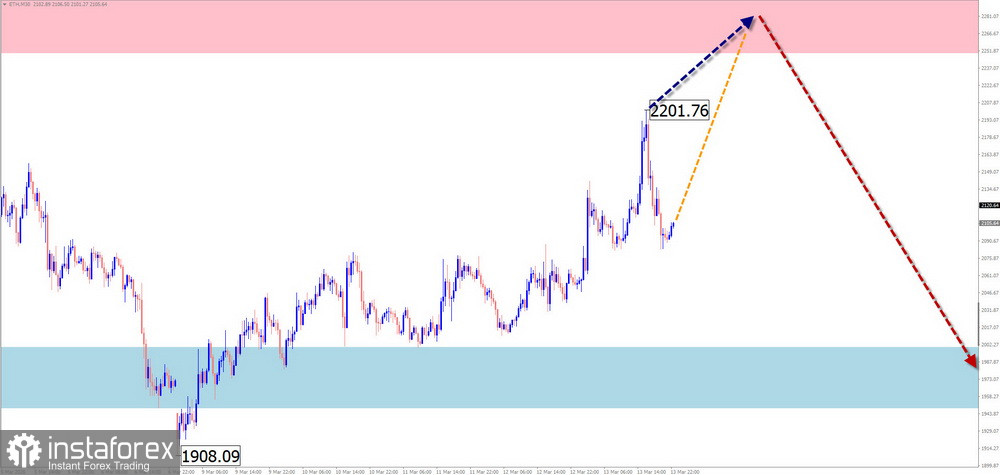
Since January, Ethereum's dominant trend has been driven by a downward wave algorithm. The wave has an impulsive structure. Over the past two months, prices have moved sideways, forming the middle part (B). Price is drifting along the lower boundary of newly formed resistance.
Forecast:
In the next few days, continued sideways movement along support is expected. After that, reversal signals may form. The highest volatility is likely toward the end of the week. A brief breakout below support cannot be ruled out during a reversal.
Potential Reversal Zones
Resistance:
Support:
Recommendations:
Litecoin
Analysis:
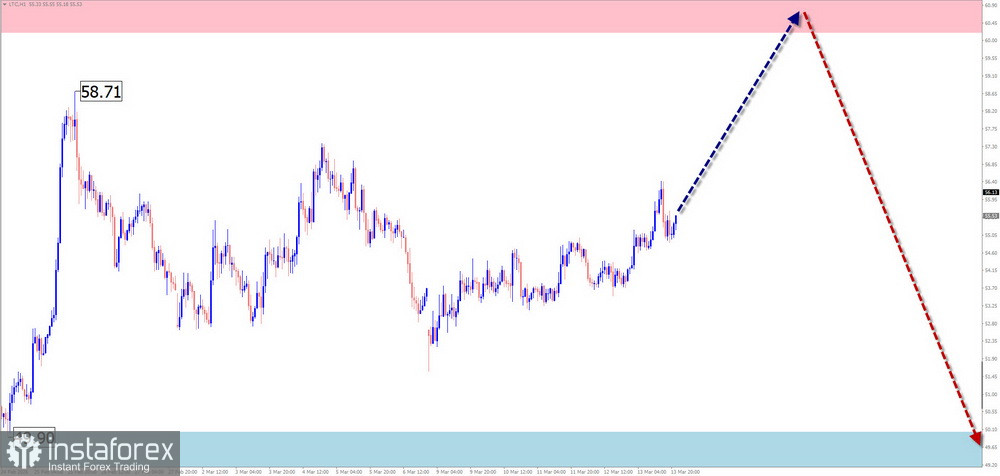
Since October last year, Litecoin has been forming a downward wave structure. Since early February, a corrective wave (B) has been developing and is still incomplete. Prices are forming a shifting flat, after which the decline is expected to continue.
Forecast:
In the next couple of days, a sideways upward move toward resistance is possible. Closer to the weekend, a renewed downward move is expected. Support defines the lower boundary of the expected weekly range.
Potential Reversal Zones
Resistance:
Support:
Recommendations:
Notes: In simplified wave analysis (SWA), all waves consist of three parts (A–B–C). The latest unfinished wave is analyzed on each timeframe. Dashed lines indicate expected movements.
Attention: The wave algorithm does not account for the duration of price movements over time!
¡Los informes analíticos de InstaForex lo mantendrá bien informado de las tendencias del mercado! Al ser un cliente de InstaForex, se le proporciona una gran cantidad de servicios gratuitos para una operación eficiente.


