 Permanecer
Condiciones de negociación
Products
Herramientas


The EUR/USD currency pair clearly intended to initiate a new phase of downward movement on Monday, despite the transformation of the downward trend to an upward one last week. However, Donald Trump decided to intervene in the currency market's price formation process and announced the imminent end of the war with Iran and the successful outcome of negotiations with Tehran. Within half an hour, Iran responded with a statement expressing surprise at the existence of any negotiation process and confirmed the continuation of the blockage of the Strait of Hormuz. Iranian officials noted that Donald Trump was simply afraid of retaliation for any strikes on energy infrastructure that he had announced over the weekend. Hence, the story about negotiations.
Whether this is true or a lie matters little. What is important is that the market believed it, and the US dollar immediately fell like a stone. Indeed, within a few days, Trump may declare that negotiations have failed, and the dollar will rise again. Therefore, traders should prepare for "volatility swings." Overall, it can be stated that an upward trend is forming; however, most traders probably expected a different type of movement. In recent days, the price has been fluctuating, but overall the trend is upward.
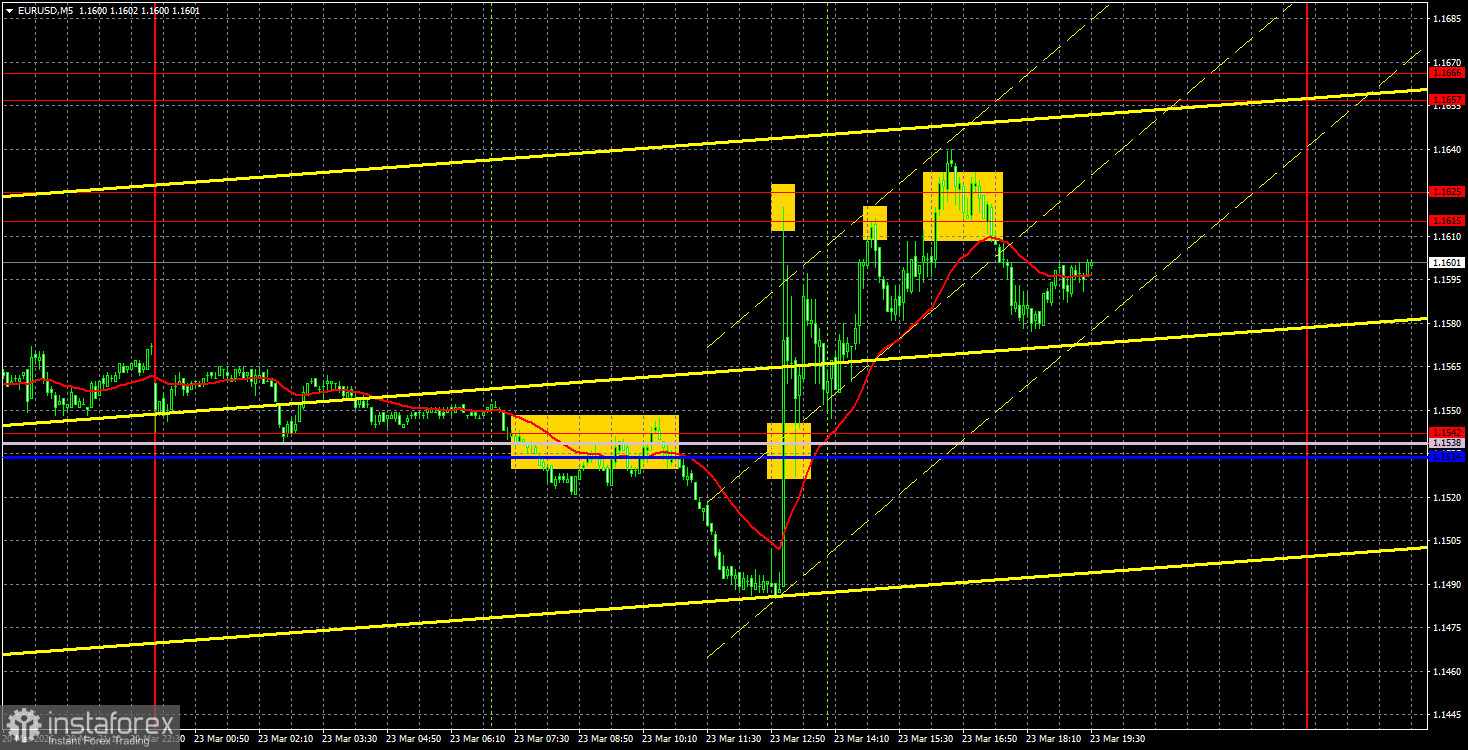
On the 5-minute timeframe yesterday, several decent trading signals were formed, but this appears to be more coincidence than a pattern. The day began with a bounce from the 1.1534-1.1542 area, allowing the price to drop by around 35 pips. Then came Donald Trump's statements. The pair immediately soared 135 pips, and the days of steady trading could be forgotten. By the end of the day, the market was tossed back and forth.
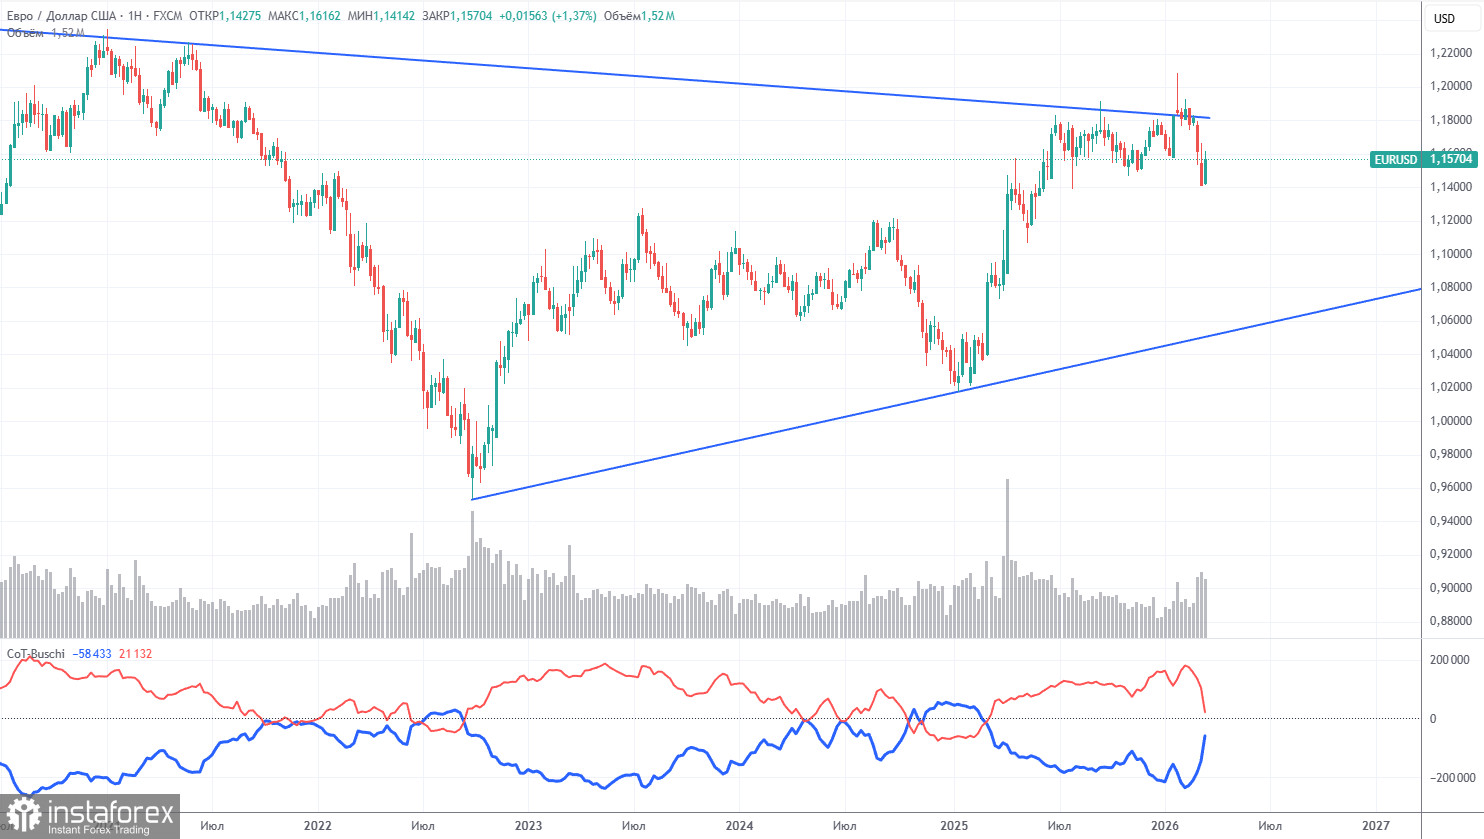
The latest COT report is dated March 17. In the weekly timeframe illustration, it is clear that the net position of non-commercial traders remains bullish but is rapidly declining due to geopolitical events at the beginning of 2026. Traders are mass selling the euro in favor of the US dollar. Donald Trump's policies have not changed, but the dollar is once again the "reserve currency," which is ensuring a sharp influx of buyers.
We see no fundamental factors that would strengthen the European currency. However, there are enough factors for a decline in the American dollar. The war in the Middle East has made the dollar temporarily super attractive, but when this factor expires, everything could return to its previous state. In the long term, the euro could fall to as low as 1.06 (trend line), but the bullish trend will still be relevant.
The positioning of the red and blue lines of the indicator continues to indicate the preservation of a bullish trend. During the last reporting week, the number of longs for the non-commercial group decreased by 52,800, while the number of shorts increased by 31,200. Consequently, the net position decreased by 84,000 contracts over the week.
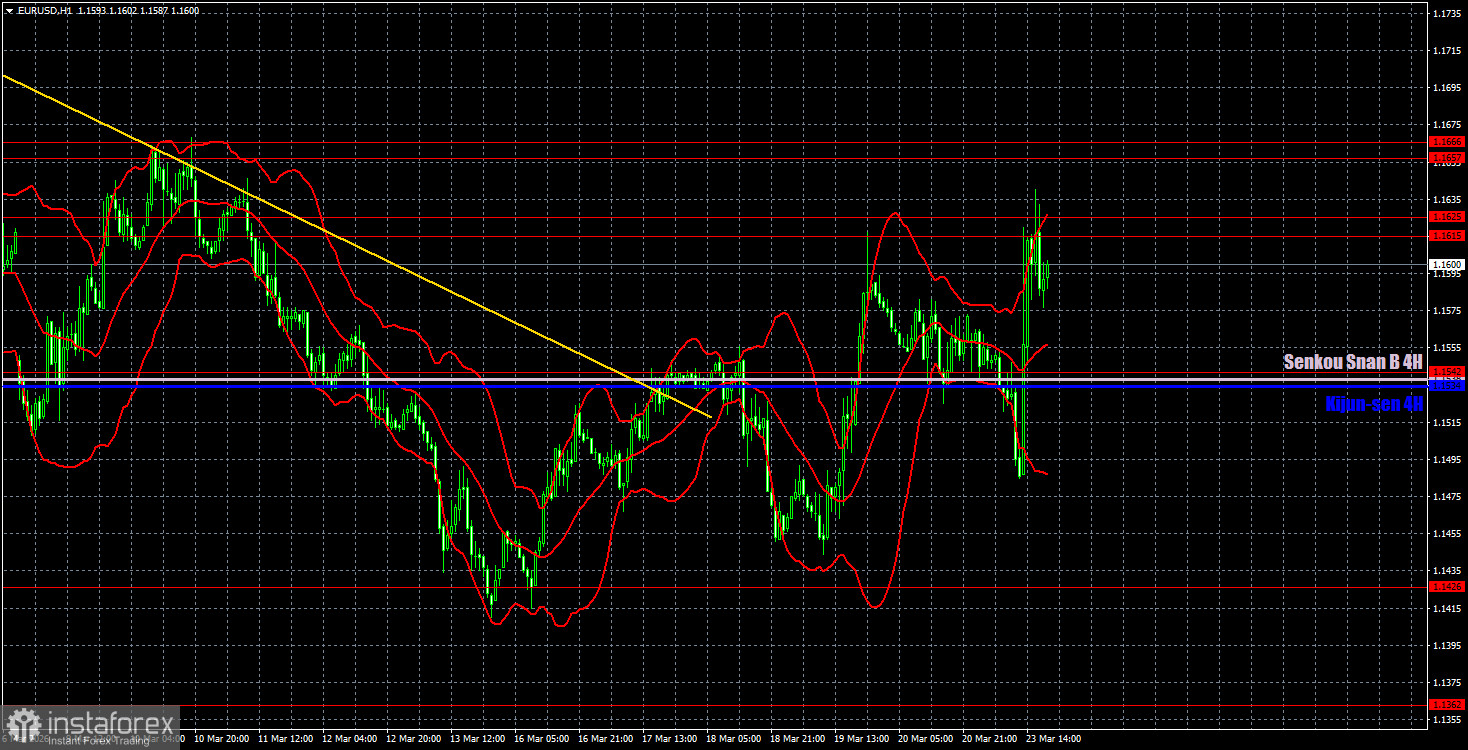
On the hourly timeframe, the EUR/USD pair could have completed its downward trend last week, but there is currently no confidence in this. New escalations in the Middle East, shocks in the oil or gas markets, and the expansion of conflict beyond the Middle East could provoke a new wave of dollar buying. Any growth in the European currency is inherently unstable right now and depends on Trump's willingness.
For March 24, we highlight the following trading levels: 1.1234, 1.1274, 1.1362, 1.1426, 1.1542, 1.1615-1.1625, 1.1657-1.1666, 1.1750-1.1760, 1.1830-1.1837, as well as the Senkou Span B line (1.1538) and Kijun-sen line (1.1534). The Ichimoku indicator lines may move during the day, which should be considered when determining trading signals. Don't forget to set a stop-loss order at breakeven if the price moves in the correct direction by 15 pips. This will protect against potential losses if the signal turns out to be false.
On Tuesday, the Eurozone and the US will publish business activity indices for the services and manufacturing sectors, and European indices will have a higher priority for traders. Also, remember that any speech from Trump could trigger similar volatility as seen on Monday. Therefore, do not forget about the Stop Loss.
On Tuesday, traders may consider short positions if the price bounces from the 1.1615-1.1625 area, targeting 1.1534-1.1542. Long positions can be opened with targets at 1.1657-1.1666 and 1.1750-1.1760 if the price breaks through the 1.1615-1.1625 area.
Support and resistance price levels are thick red lines near which movement may end. They are not sources of trading signals.
The Kijun-sen and Senkou Span B lines are Ichimoku indicator lines transferred from the 4-hour timeframe to the hourly timeframe. They are strong lines.
Extreme levels are thin red lines from which the price has previously bounced. They are sources of trading signals.
Yellow lines indicate trend lines, trend channels, and any other technical patterns.
Indicator 1 on COT charts represents the size of the net position for each category of traders.
¡Los informes analíticos de InstaForex lo mantendrá bien informado de las tendencias del mercado! Al ser un cliente de InstaForex, se le proporciona una gran cantidad de servicios gratuitos para una operación eficiente.


