 Permanecer
Condiciones de negociación
Products
Herramientas


During Wednesday, the EUR/USD pair reversed in favor of the US dollar and consolidated below the 100.0% Fibonacci retracement level at 1.1577. Thus, the downward movement may continue toward the next Fibonacci level of 127.2% at 1.1440. A move back above the 1.1577 level would favor the euro and a resumption of growth toward the 76.4% retracement level at 1.1696.
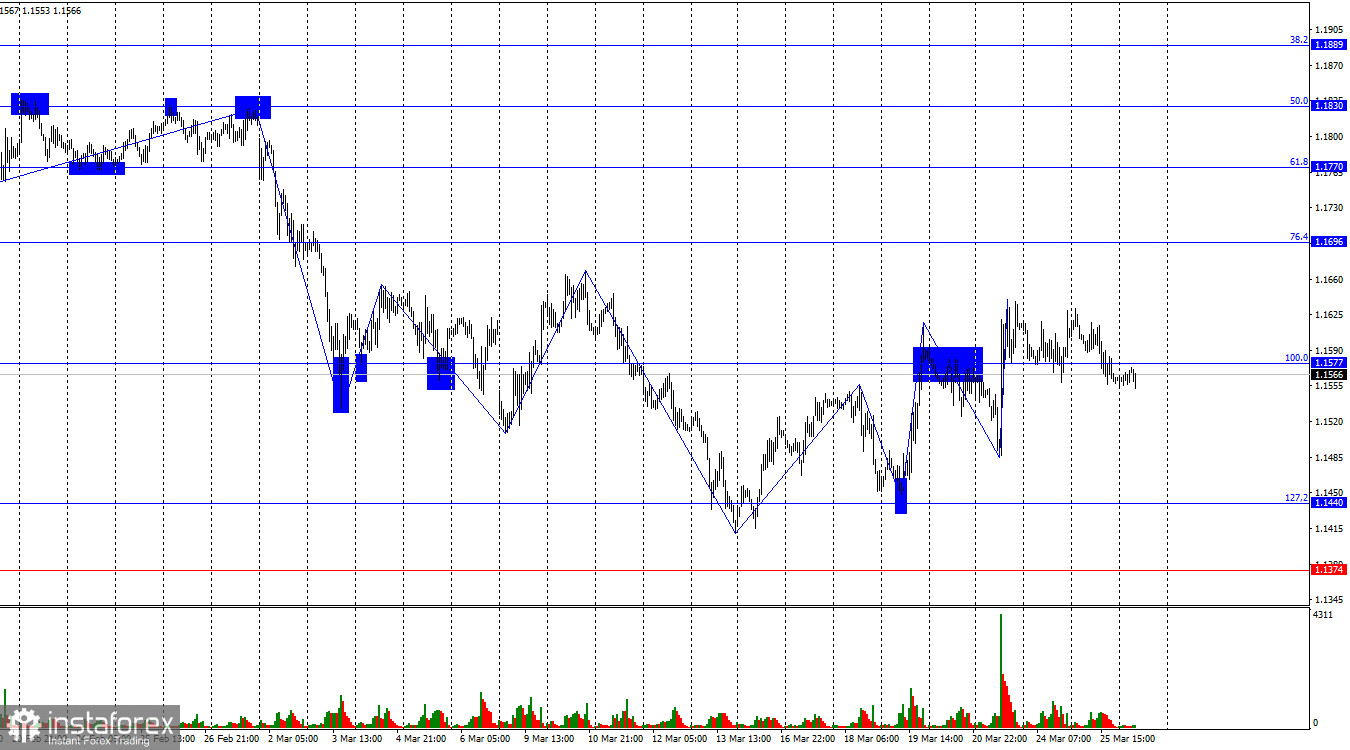
The wave structure on the hourly chart remains clear. The last completed downward wave did not break the low of the previous wave, while the last upward wave broke the previous peak. Therefore, the trend is currently continuing to shift toward bullish. Actions by Donald Trump in the Middle East have triggered large-scale military activity in the region involving about a dozen countries, which allows the dollar to count on further strengthening.
There were few economic releases on Wednesday, and traders found nothing of particular interest in them. Their attention remains focused on Iran and the United States. It should be noted that signals from both America and the Middle East are abundant but contradictory. Throughout the current week, Trump has repeatedly stated that Washington and Tehran will reach a deal in the near future—or at least begin negotiations. Traders believed Trump on Monday, but several statements from high-ranking Iranian officials later dispelled any hopes for a peaceful outcome. Tehran rejected any negotiations, stating that Washington is essentially negotiating with itself. At the same time, it is reportedly preparing for a new military operation involving amphibious forces.
The United States is indeed considering the possibility of a ground operation, and analysts also note that the target could be Kharg Island, through which nearly all of Iran's oil exports pass. It is worth recalling that Iran continues to sell oil to China and other Asian countries. Thus, an attack on Kharg Island could aim to completely cut Iran off from financial revenues derived from energy exports. In my view, this week's signals point to a looming escalation of the conflict rather than de-escalation.
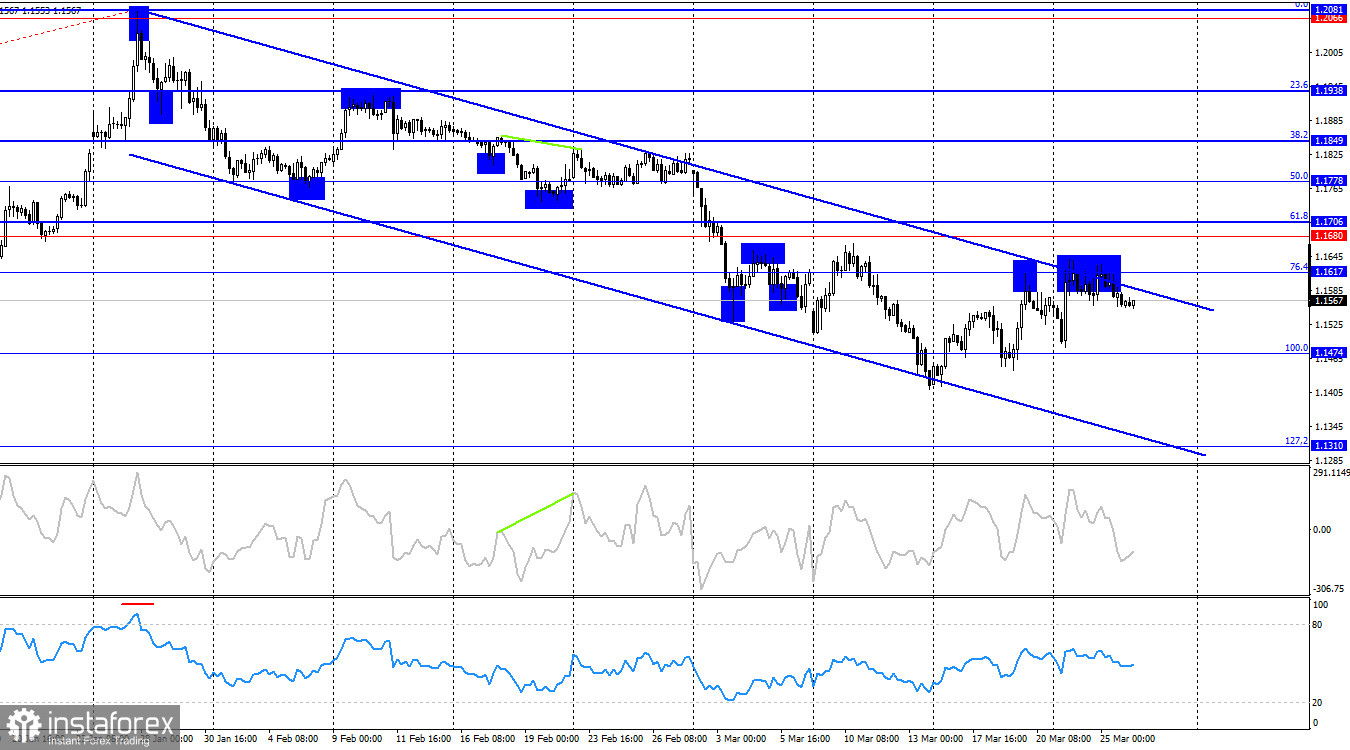
On the 4-hour chart, the pair rose to the 76.4% Fibonacci level at 1.1617. A rebound from this level worked in favor of the US dollar and initiated a decline toward the 100.0% retracement level at 1.1474. A bullish trend will become possible after the euro closes above the descending trend channel. The first target for bulls is the 1.1706 level. No emerging divergences are observed on any indicator.
Commitments of Traders (COT) Report:
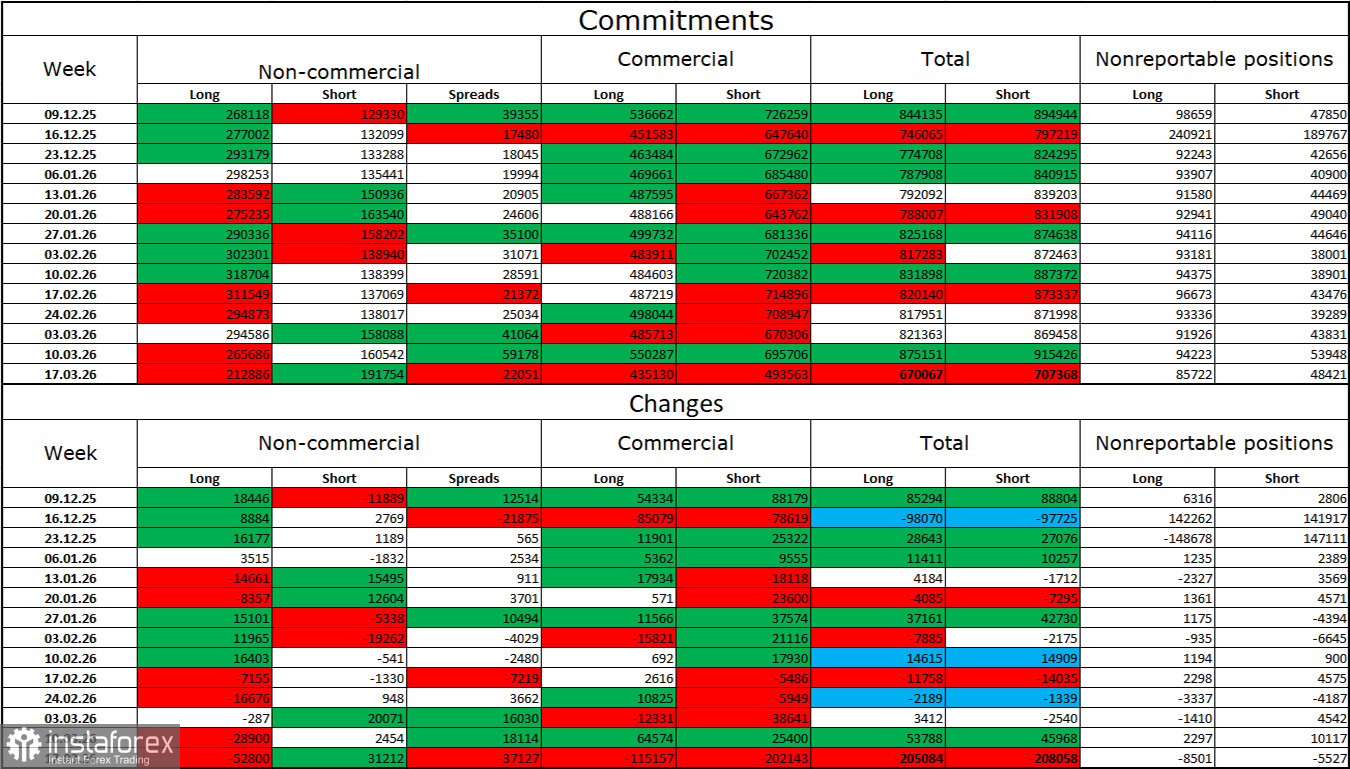
During the last reporting week, professional traders closed 52,800 long positions and opened 31,212 short positions. The sentiment of the "Non-commercial" group remains bullish due to Donald Trump and his policies, but in recent weeks we have seen an active reduction in long positions and an increase in short positions. The total number of long positions held by speculators now stands at 213,000, while short positions total 191,000. The bulls' advantage has nearly disappeared within just a few weeks.
Overall, in the long term, major players continue to show strong interest in the euro. Of course, global events—of which there has been no shortage in recent years—affect investor sentiment in different ways. At present, all market attention is focused on the Middle East, where the war continues to intensify and expand geographically. Thus, in the near term, the euro and dollar exchange rate will depend not on the monetary policies of the Federal Reserve or the European Central Bank, nor on economic data, but on the war in Iran. For now, the dollar is extracting maximum benefit from this situation.
News Calendar for the US and the Eurozone:
On March 26, the economic calendar contains only two entries, neither of which is particularly significant. The impact of the news background on market sentiment on Thursday may be weak.
EUR/USD Forecast and Trading Tips:
Selling opportunities were available after consolidation below the 1.1577 level with a target of 1.1440. Buy trades will become possible after the pair closes above the 1.1577 level with a target of 1.1696.
Fibonacci levels are drawn from 1.1577–1.2082 on the hourly chart and from 1.1474–1.2082 on the 4-hour chart.
¡Los informes analíticos de InstaForex lo mantendrá bien informado de las tendencias del mercado! Al ser un cliente de InstaForex, se le proporciona una gran cantidad de servicios gratuitos para una operación eficiente.


