 Permanecer
Condiciones de negociación
Products
Herramientas


The GBP/USD pair attempted to extend its upward move on Thursday, near local highs. However, in the evening, the British currency declined, which may have been purely technical. At least during that time, no official news related to geopolitics was received on the market. There was only a report of explosions heard in several regions of Iran, but no information about their nature or cause was available. Nevertheless, buyers may have stepped back slightly amid concerns about the resumption of the conflict. Let's remember that just on Monday, a full-scale war could have resumed in the Middle East. The truce remains practically fragile. Today, important labor and unemployment data will be released in the US, which may provoke significant market volatility. However, it is also important not to forget about the geopolitical backdrop. The situation in the Middle East remains unstable, and new missiles could be launched at any moment, or another diplomatic failure could be announced.
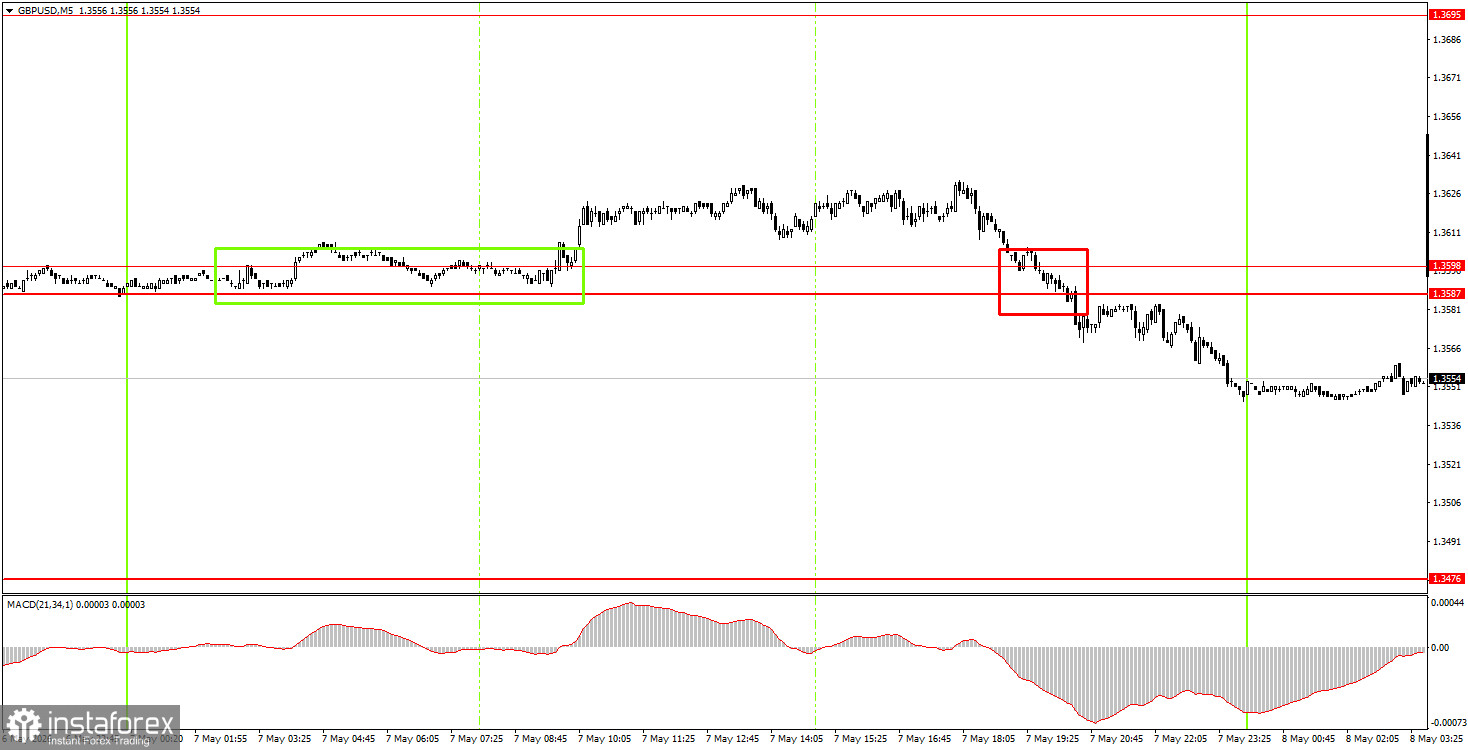
On the 5-minute timeframe, two trading signals were generated on Thursday. During the European trading session, the pair rebounded from the 1.3587-1.3598 area, and during the American session, it consolidated below it. Therefore, long positions did not yield profits for beginner traders, while short positions could be carried over to Friday.
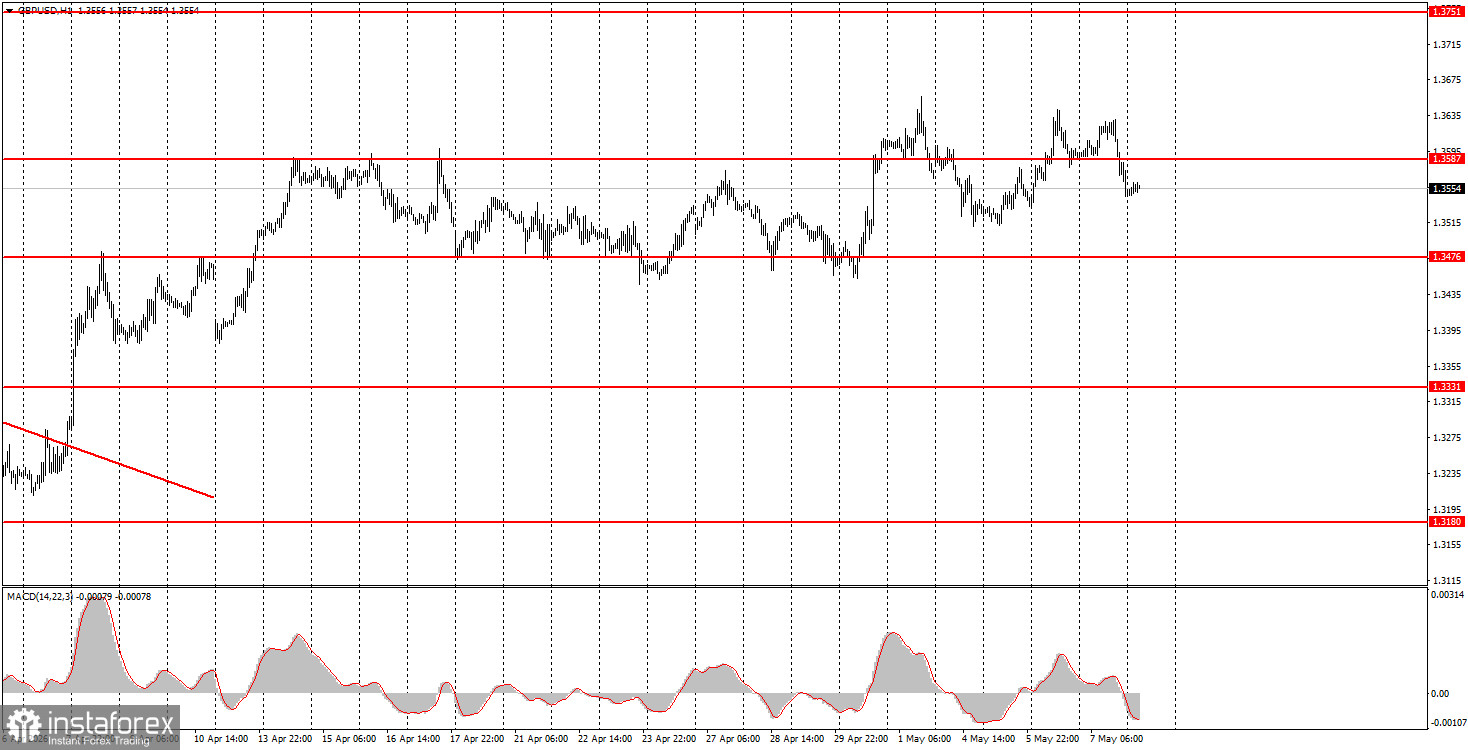
On the hourly timeframe, the GBP/USD pair maintains an upward trend but has been trading sideways for almost a month. Without a serious escalation in the Middle East, the dollar will no longer be able to sustain the growth it showed in February and March. Individual events may still trigger their strengthening, but overall, the geopolitical factor has receded. The British currency shows promising upward prospects according to trends on the daily and weekly timeframes.
On Friday, beginner traders may stay in short positions targeting 1.3456-1.3476, as the price consolidated below the 1.3587-1.3598 area. If the price consolidates above the 1.3587-1.3598 area, long positions can be opened targeting 1.3695.
On the 5-minute timeframe, the following levels should be considered: 1.3175-1.3180, 1.3259-1.3267, 1.3319-1.3331, 1.3380-1.3386, 1.3456-1.3476, 1.3587-1.3598, 1.3695, and 1.3741-1.3751. Today, the UK calendar of events is completely empty, while the US will release important reports on Nonfarm Payrolls and the unemployment rate. Additionally, it's important not to forget about geopolitical factors.
Price levels (areas) of support and resistance – levels that are targets when opening purchases or sales, or sources of signals.
Red lines – channels or trend lines that display the current trend and indicate which direction is preferable to trade now.
MACD indicator (14, 22, 3) – histogram and signal line – a supporting indicator that can also be used as a source of signals.
Important speeches and reports (contained in the news calendar) can significantly influence the movement of the currency pair. Therefore, during their release, trading should be done as cautiously as possible, or one should exit the market to avoid a sharp price reversal against the preceding movement.
Beginners trading in the Forex market should remember that not every trade can be profitable. Developing a clear strategy and sound money management are key to long-term trading success.
¡Los informes analíticos de InstaForex lo mantendrá bien informado de las tendencias del mercado! Al ser un cliente de InstaForex, se le proporciona una gran cantidad de servicios gratuitos para una operación eficiente.


