 Permanecer
Condiciones de negociación
Products
Herramientas


The EUR/USD currency pair resumed its downward movement on Thursday, although there were few strong reasons for this. However, the market is again anticipating an escalation of the conflict in the Middle East, and there are all grounds for this. After another failure in negotiations between Iran and the US was announced on Monday, no further information has been received. In other words, the negotiations between Tehran and Washington are currently on pause, and the parties are again exchanging mutual threats. Traders justifiably concluded that the absence of negotiations equals the resumption of conflict. The only question is timing. Thus, the US dollar has been in demand throughout the current week. Additionally, the market now allows for the possibility that the Federal Reserve's stance may shift to a more "hawkish" one due to rapidly rising inflation.
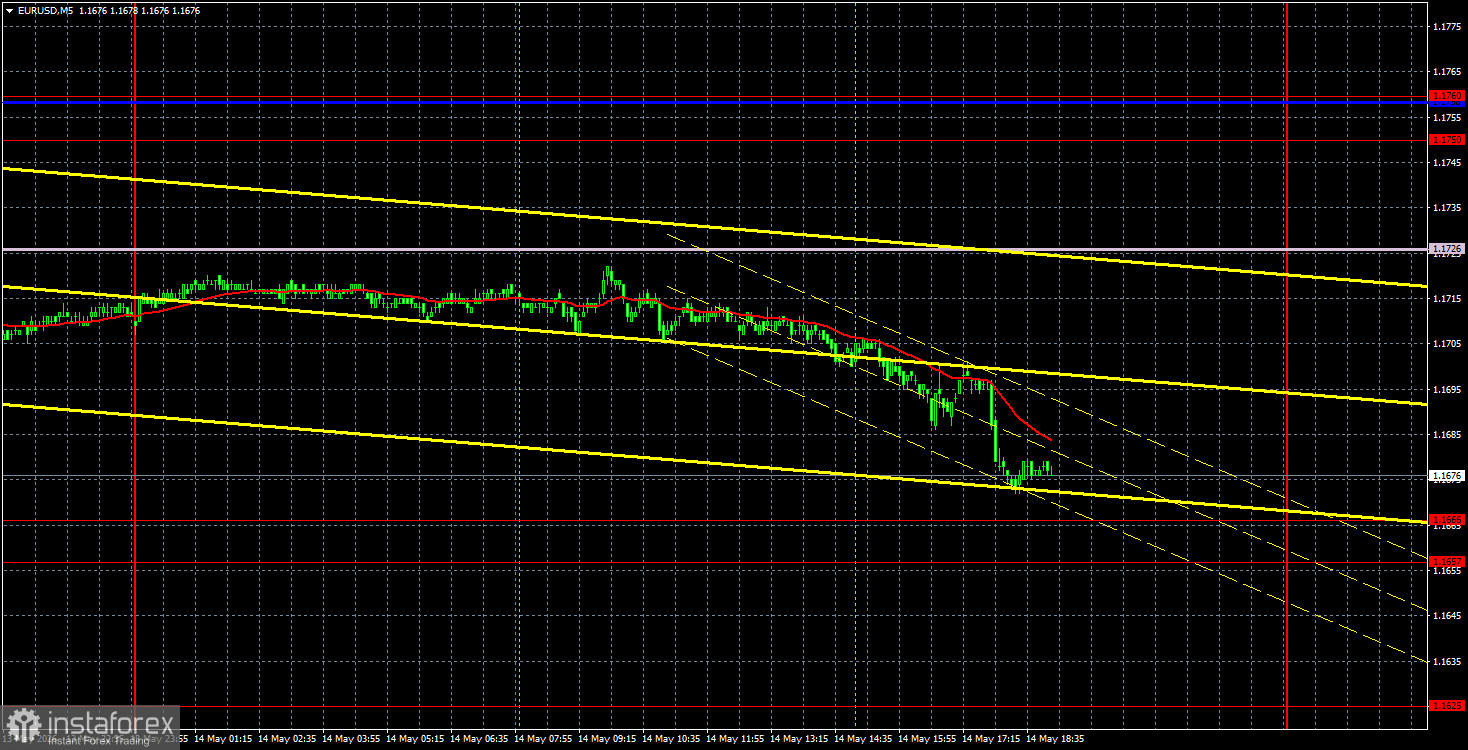
From a technical perspective, a new downward trend is forming, but we still assume the EUR/USD pair is within the sideways channel of 1.1666-1.1786. Therefore, attention should be focused on the area between 1.1657 and 1.1666. We have repeatedly noted that the geopolitical factor is weakening its influence on the currency market, and the dollar has been rising for nearly an entire week. Around the area of 1.1657-1.1666, its ascent may come to an end.
On the 5-minute timeframe on Thursday, no trading signals were formed. The pair approached the Senkou Span B line during the European trading session, but failed to act on it. Thus, the last sell signal was generated on Wednesday, following the breach of the Senkou Span B line. Short positions could very well be carried over to Thursday.
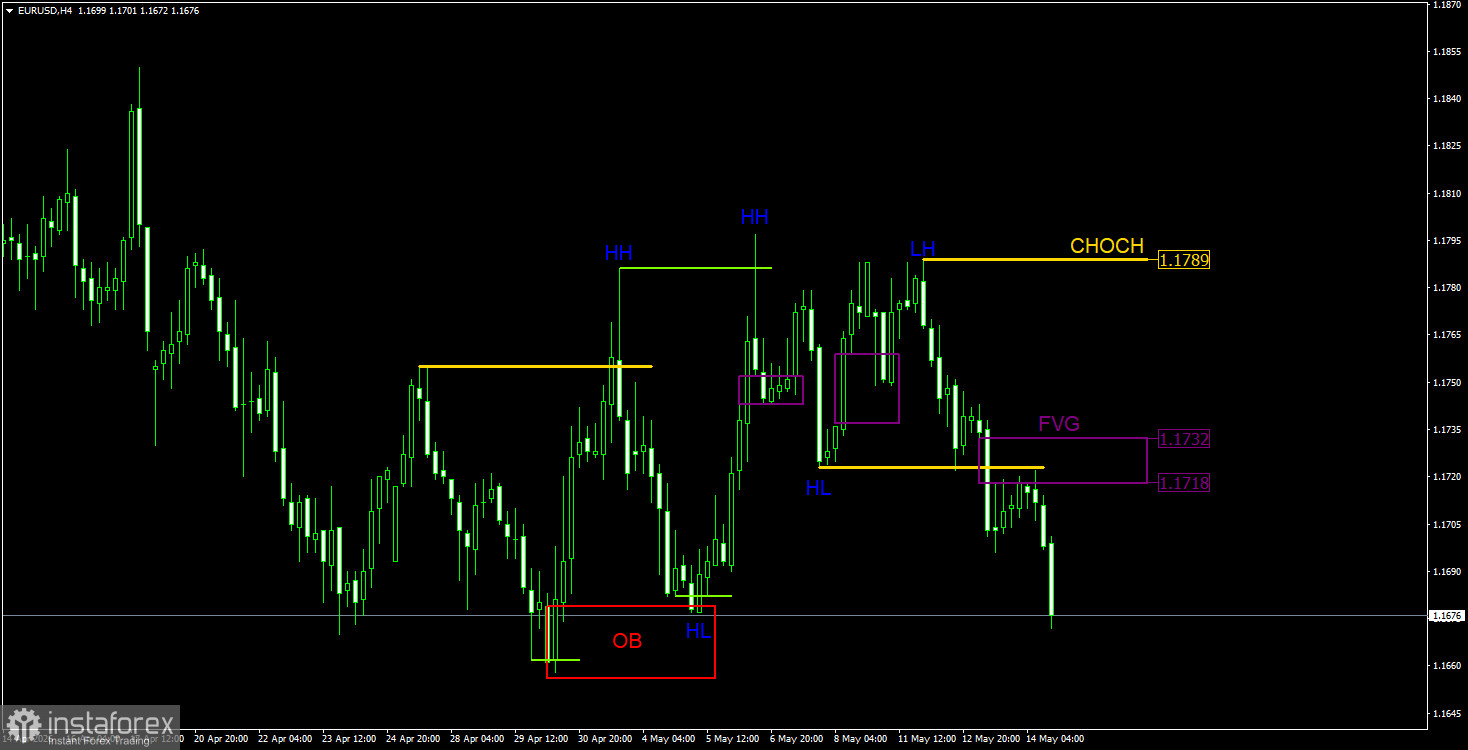
On the 4-hour timeframe, according to the ICT trading system, the situation was favorable for traders on Thursday. The upward trend was broken, a "bearish" FVG pattern formed in the area of 1.1718-1.1732, and then a clear sell signal was generated there, as we had warned the day before. Thus, traders could open short positions in line with the trend and from a clear area of POI. The last few candles were formed with gaps, so a new bearish FVG will be formed at their locations, from which new short positions can be opened in the future. The only caveat is to remember the possibility of a flat and the inability to breach the 1.1657-1.1666 area.
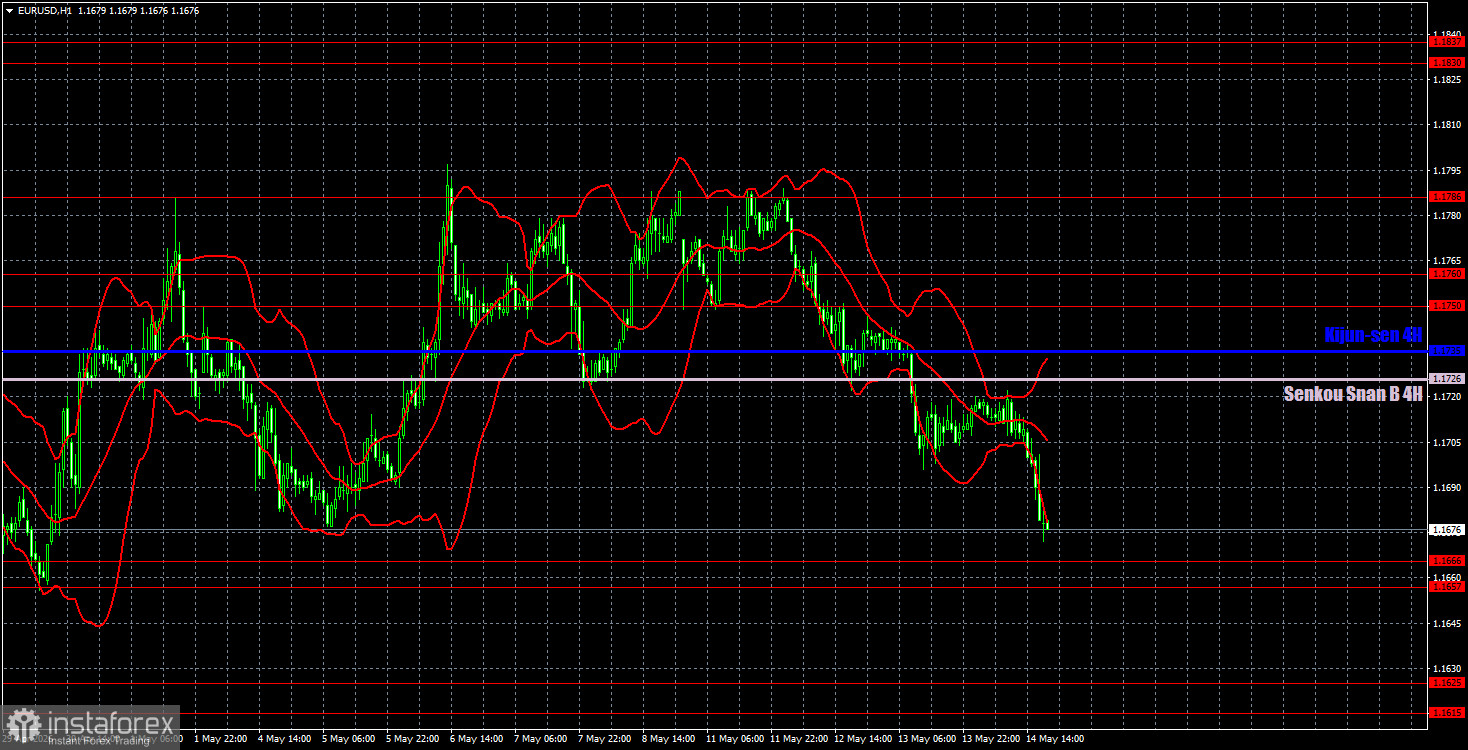
On the hourly timeframe, the EUR/USD pair has turned downward. The situation in the Middle East remains tense, not getting any worse, but negotiations have stalled once again, allowing the dollar to show restrained growth. In the near future, the euro may drop to the area of 1.1657-1.1666, but whether it will go lower is a big question, as the probability of a flat remains in the range of 1.1666-1.1786.
On May 15, we highlight the following levels for trading: 1.1362, 1.1426, 1.1542, 1.1615-1.1625, 1.1657-1.1666, 1.1750-1.1760, 1.1786, 1.1830-1.1837, 1.1907-1.1922, as well as the Senkou Span B line (1.1726) and the Kijun-sen (1.1735). The Ichimoku indicator lines may shift during the day, which should be taken into account when determining trading signals. Don't forget about setting the Stop Loss order to breakeven if the price moves in the correct direction by 15 pips. This will safeguard against potential losses if the signal turns out to be false.
On Friday, no major events are scheduled in the European Union, while a report on industrial production will be released in the US. It is unlikely that the market will react to this report, so everything will depend on geopolitics and technical factors on the last trading day of the week.
Today, traders may open new short positions with a target in the 1.1615-1.1625 area and lower upon the price consolidating below the 1.1657-1.1666 area. Long positions can be opened in the case of a price bounce from the 1.1657-1.1666 area, with targets at 1.1726 and 1.1750-1.1760. On the 4-hour timeframe, one should expect the formation of new bearish patterns.
¡Los informes analíticos de InstaForex lo mantendrá bien informado de las tendencias del mercado! Al ser un cliente de InstaForex, se le proporciona una gran cantidad de servicios gratuitos para una operación eficiente.


