 Permanecer
Condiciones de negociación
Products
Herramientas


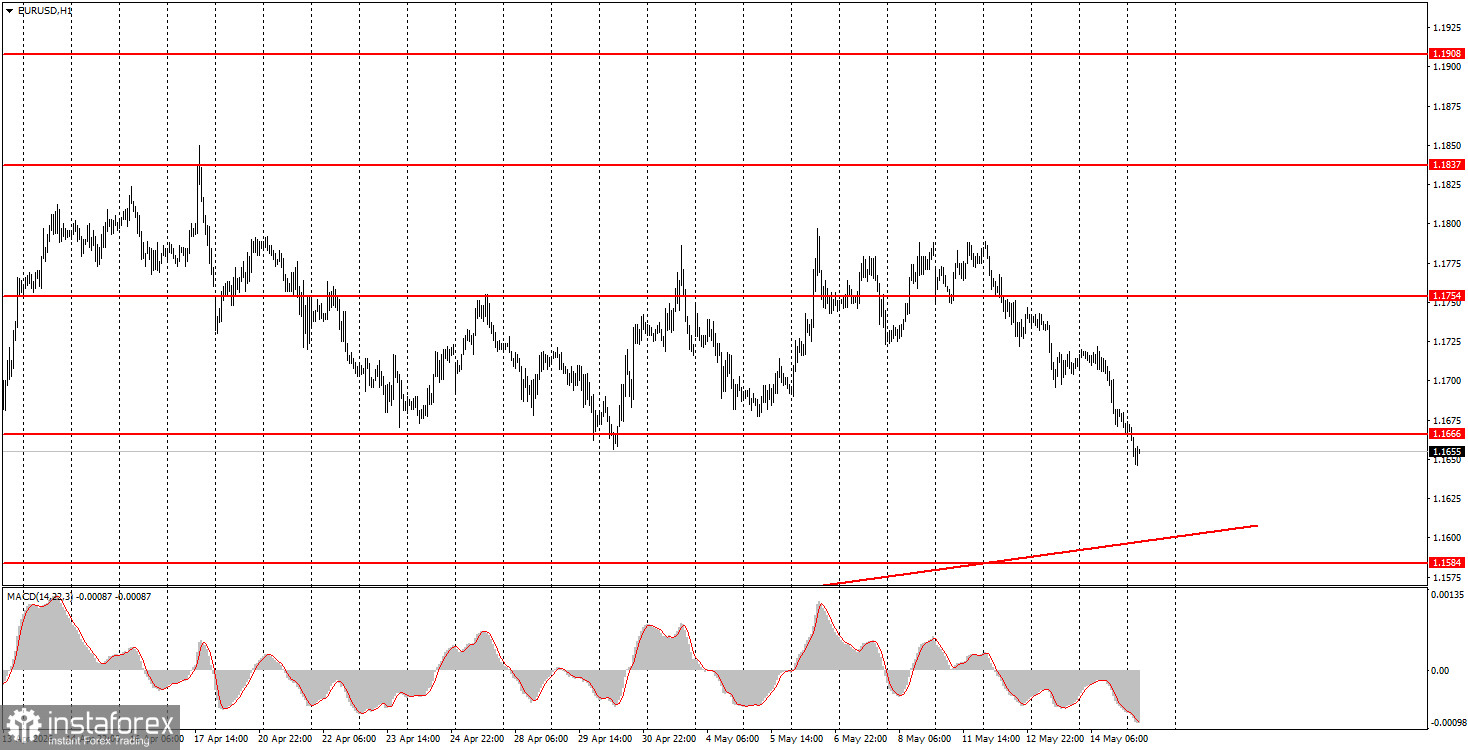
The EUR/USD currency pair continued its downward movement on Thursday, which began on Monday when news of a failed negotiation between Iran and the US broke. Since then, no positive information regarding the military conflict has been received. The parties have not officially exited the negotiation process, but it is unclear whether any telephone dialogue is currently taking place. As a result, market optimism regarding peace in the Middle East and the unblocking of the Strait of Hormuz has sharply diminished. Consequently, the dollar has been rising for the fifth consecutive day. But how long can this geopolitical factor support the dollar this time? We believe not for long. On the hourly or 4-hour timeframe, it is clear that the current movement, which began on April 17, is a correction against a stronger impulsive move. Thus, we are witnessing a prolonged and complex correction that does not yet have much chance of becoming an impulse. If war in the Middle East resumes (which could happen at any time), the dollar will have a reason for a trend. However, even in that case, we do not expect the pair to fall below the March lows.
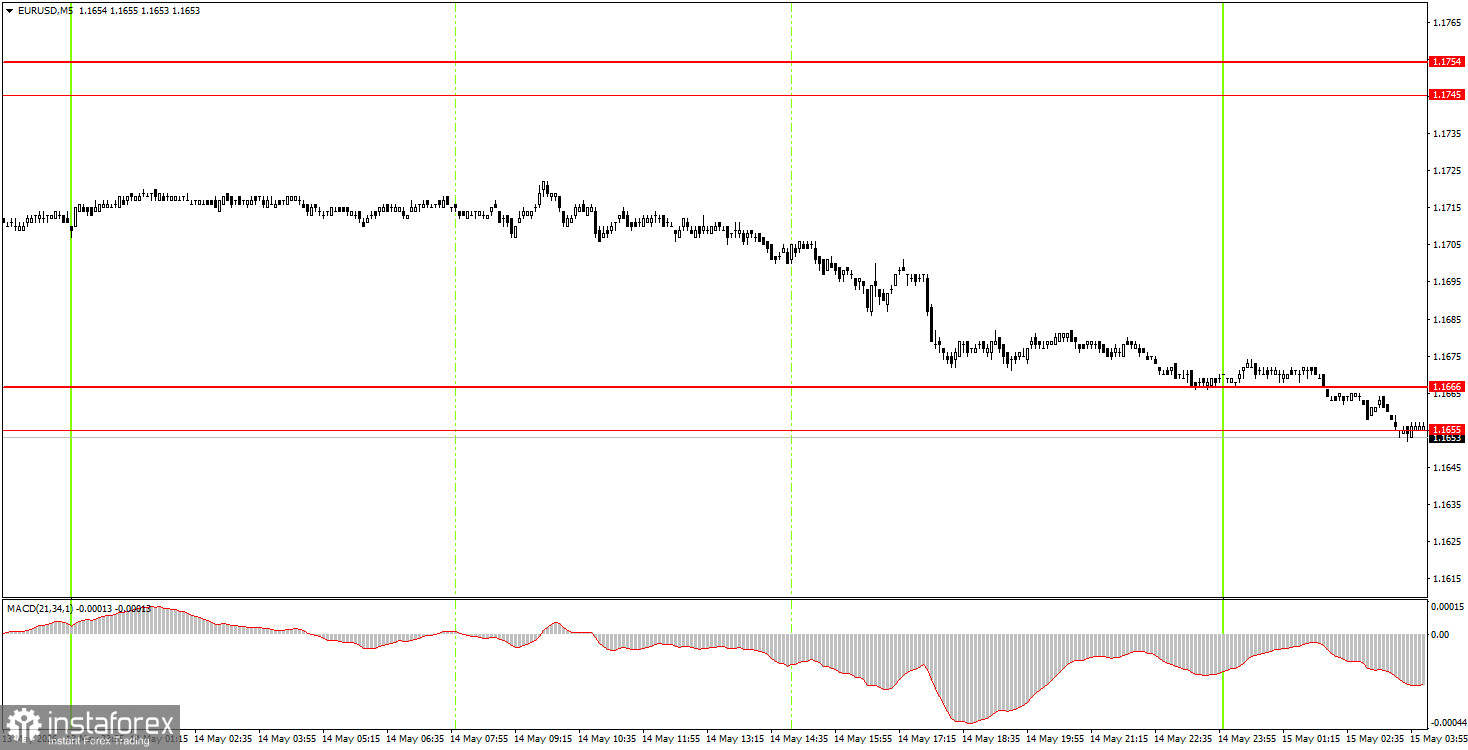
On the 5-minute timeframe, no trading signals were generated on Thursday, and the day's overall volatility was again not the highest. The last sell signals were generated on Tuesday, and novice traders, considering the weak volatility, could have carried them over to Wednesday and even Thursday. As a result, the target area of 1.1655-1.1666 was achieved.
On the hourly timeframe, the upward trend is maintained, and the euro has been in correction for several weeks. The rise of the US dollar has resumed, as the conflict in the Middle East is on the brink of escalation, but we do not expect long-term growth for the US currency. The market continues to ignore fundamentals and macroeconomics.
On Friday, novice traders can open short positions targeting 1.1584-1.1591 if the price consolidates below the 1.1655-1.1666 area. Long positions can be considered if the price consolidates above the 1.1655-1.1666 area, with targets at 1.1745-1.1754.
On the 5-minute timeframe, the following levels should be considered: 1.1354-1.1363, 1.1413, 1.1455-1.1474, 1.1527-1.1531, 1.1584-1.1591, 1.1655-1.1666, 1.1745-1.1754, 1.1830-1.1837, 1.1899-1.1908. On Friday, there are no significant macroeconomic events scheduled in the European Union, while in the US, a report on industrial production will be released. This report is interesting, but the market is unlikely to notice it, as it has not noticed most data over the past three months.
Price levels (areas) of support and resistance – levels that are targets when opening purchases or sales, or sources of signals.
Red lines – channels or trend lines that display the current trend and indicate which direction is preferable to trade now.
MACD indicator (14, 22, 3) – histogram and signal line – a supporting indicator that can also be used as a source of signals.
Important speeches and reports (contained in the news calendar) can significantly influence the movement of the currency pair. Therefore, during their release, trading should be done as cautiously as possible, or one should exit the market to avoid a sharp price reversal against the preceding movement.
Beginners trading in the Forex market should remember that not every trade can be profitable. Developing a clear strategy and effective money management are key to long-term trading success.
¡Los informes analíticos de InstaForex lo mantendrá bien informado de las tendencias del mercado! Al ser un cliente de InstaForex, se le proporciona una gran cantidad de servicios gratuitos para una operación eficiente.


