 Permanecer
Condiciones de negociación
Products
Herramientas


The GBP/USD currency pair continued its downward movement on Friday, which, in recent days, has resembled a collapse. The geopolitical factor, the new political crisis in the UK, and high US inflation are the reasons for the British pound's decline last week. However, will the decline continue into the new week? We are very skeptical about this, as we believe that the market has already oversold the pound and bought the dollar. From a technical standpoint, there are currently no signs of an end to the collapse. On Friday, the UK calendar was empty, while the US released an industrial production report that further pressured the British pound. In the first half of the day, the UK currency attempted to recover, but during the American session, it became clear that April production had increased by 0.7% month-on-month, against forecasts of 0.1-0.3%. Although this is not the most significant report (especially in the current circumstances), it still exerted pressure on the GBP/USD pair.
From a technical perspective, the downward trend on the hourly timeframe is unquestionable. This is not just a trend; it is a collapse. There are no trend lines as the price does not correct. Traders can only rely on technical levels and Ichimoku indicator lines. With the 1.3369-1.3377 area breached, there is a high probability of further decline. However, in our view, this will require new geopolitical negativity.
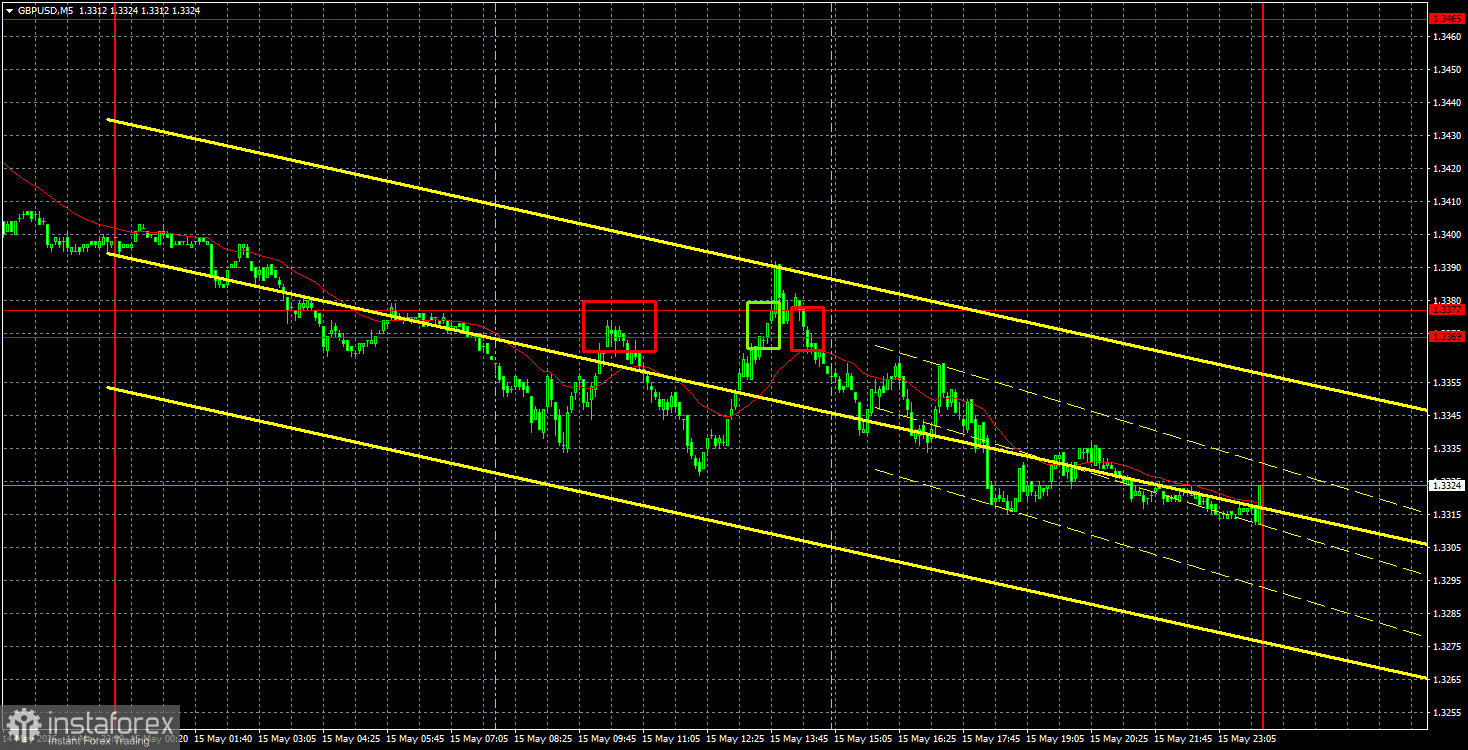
On the 5-minute timeframe on Friday, three trading signals were formed. Unfortunately, just before the start of the American session, the pair briefly consolidated above the 1.3369-1.3377 range, forming a buy signal that proved false, resulting in a loss for traders. However, the other two signals allowed for a profit of at least 35 pips.
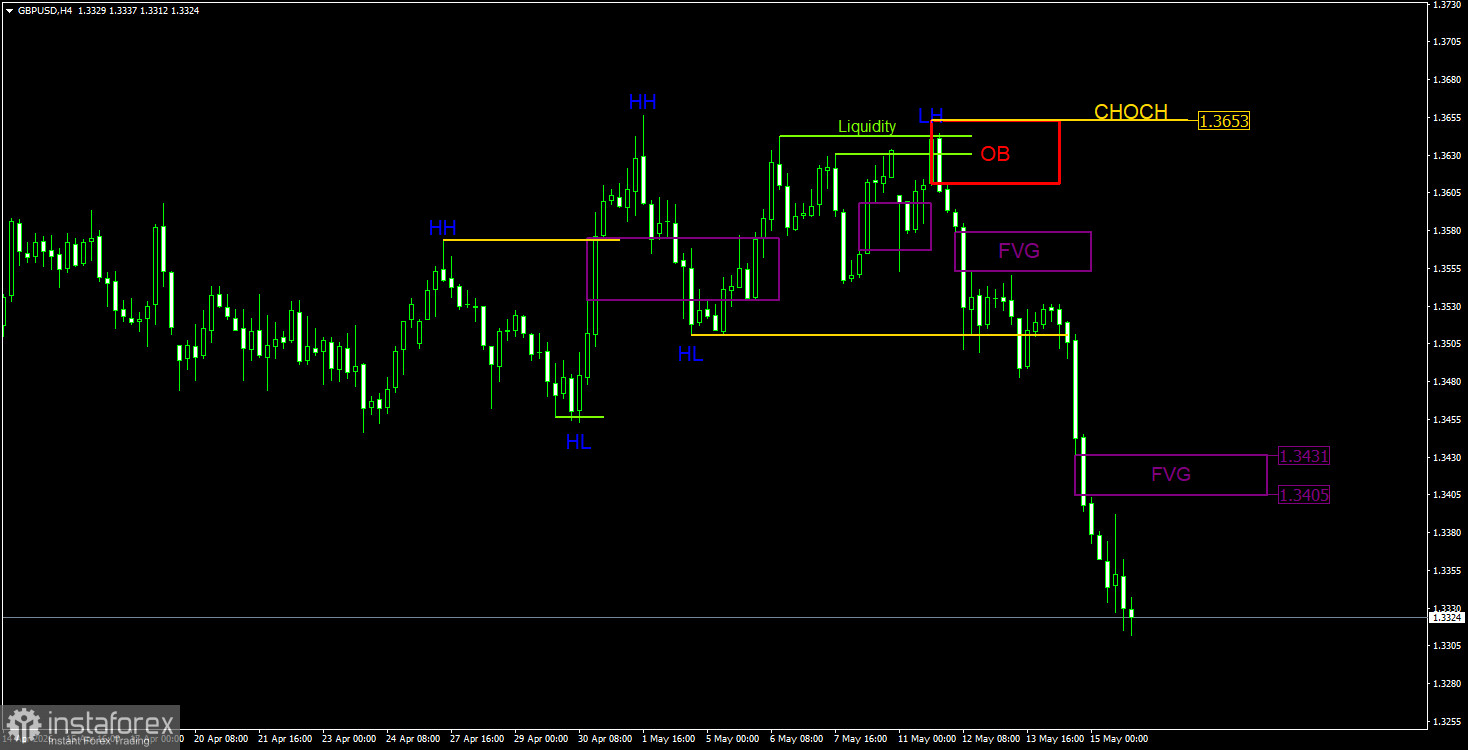
On the 4-hour timeframe, we analyze according to the ICT trading system. The British pound is highly correlated with the euro, so patterns and signals from EUR/USD should always be monitored. Last week, there was just such a situation. A sell signal was formed for the euro, but none for the British pound. Nevertheless, both pairs experienced significant declines. The trend on the 4-hour timeframe has shifted downward, as the CHOCH line was broken. During the last phase of the decline, a clear bearish FVG was formed, which will serve as a POI for short positions on Monday and Tuesday.
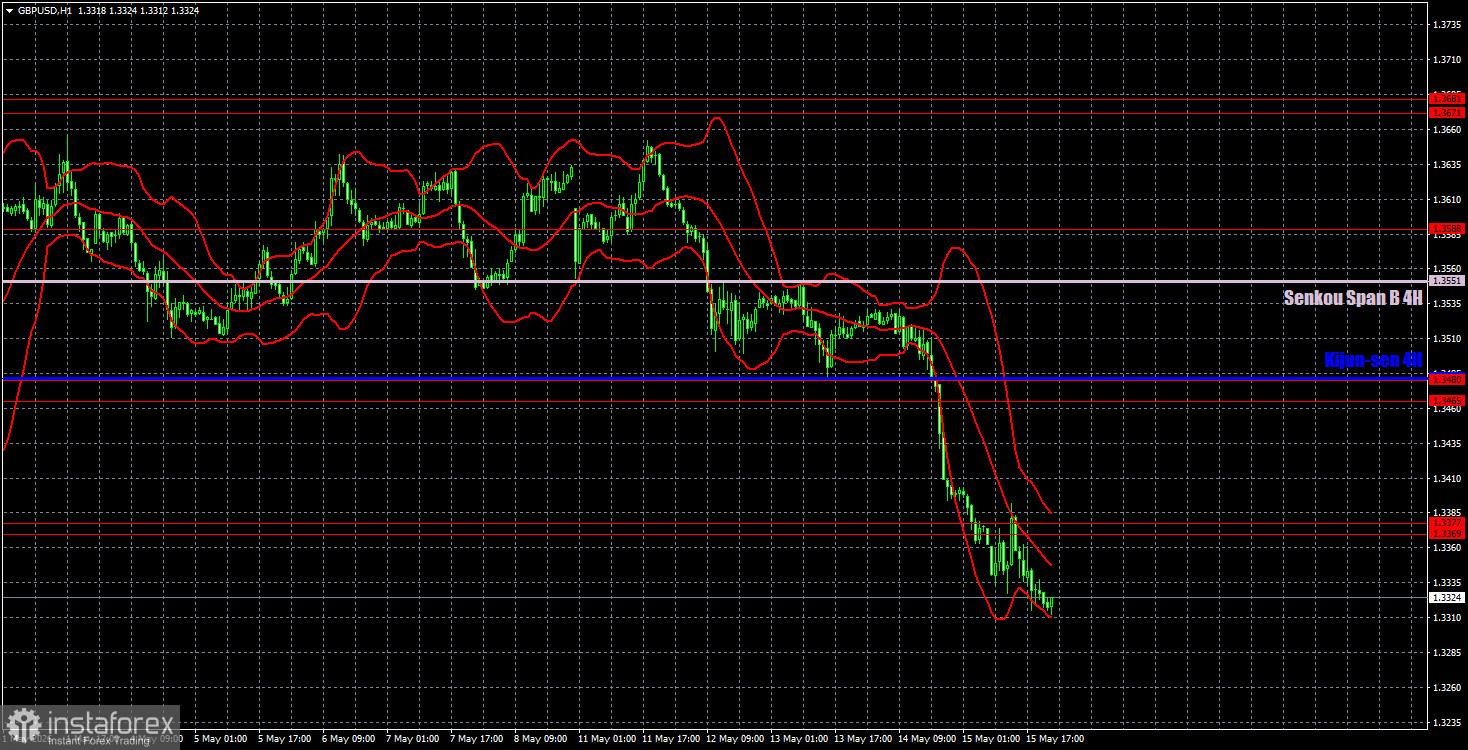
On the hourly timeframe, the GBP/USD pair has been trading in one direction—south—for an entire week. The macroeconomic and fundamental backdrop continues to have little impact on the pair's movements, while geopolitics pulls the British pound down. Although it would be more correct to say it is lifting the US dollar to new highs. However, we do not believe that the dollar will continue to strengthen without a real escalation in the Middle East.
For May 18, we highlight the following important levels: 1.3096-1.3115, 1.3179-1.3187, 1.3369-1.3377, 1.3465-1.3480, 1.3588, 1.3671-1.3681, 1.3751-1.3763. The Senkou Span B line (1.3551) and Kijun-sen (1.3480) may also serve as sources for signals. It is recommended to set the stop-loss order to breakeven once the price moves in the correct direction by 20 pips. The Ichimoku indicator lines may shift during the day, which should be taken into account when determining trading signals.
On Monday, no significant events or reports are scheduled in the UK, and the US calendar is also empty. Traders should continue to monitor geopolitical news closely.
Today, traders may remain in short positions after consolidating the price below the 1.3369-1.3377 area, targeting 1.3179-1.3187. Long positions can be opened if the price consolidates above the 1.3369-1.3377 area, with targets of 1.3465-1.3480. On the 4-hour timeframe, traders should expect sell signals to form in the bearish FVG.
¡Los informes analíticos de InstaForex lo mantendrá bien informado de las tendencias del mercado! Al ser un cliente de InstaForex, se le proporciona una gran cantidad de servicios gratuitos para una operación eficiente.


