 Permanecer
Condiciones de negociación
Products
Herramientas


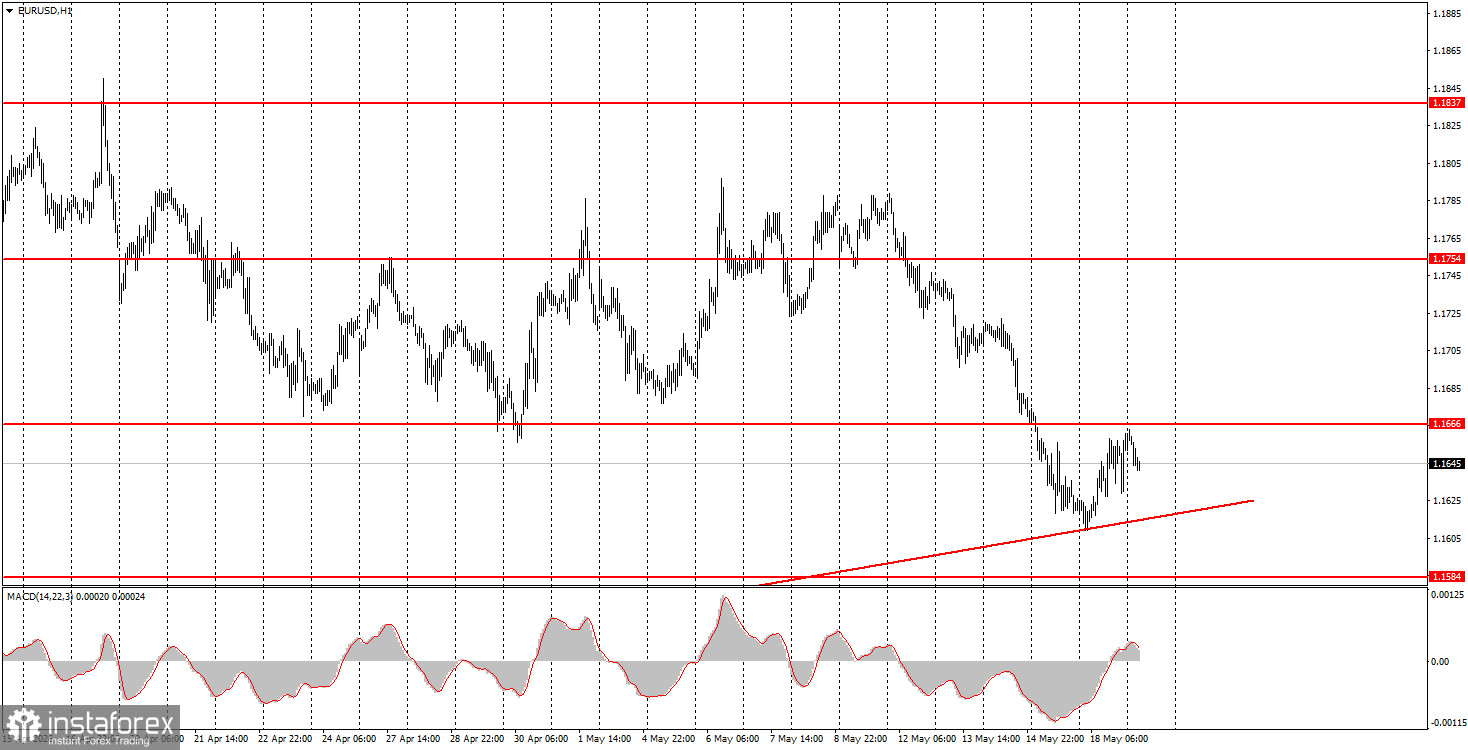
The EUR/USD currency pair began a weak recovery on Monday after last week's collapse. Currently, the euro's growth is minimal and may be linked to a slight thaw in relations between Iran and the US. After an entire week of heightened geopolitical tension, it became known on Monday that Washington agreed to temporarily lift sanctions on Iranian oil. As of now, it remains unclear what exactly this means—whether it implies the lifting of the blockade of the Strait of Hormuz or something else. The strait blockade remains in effect, as Washington has only agreed to lift sanctions but has not yet done so. Thus, a small step toward renewing negotiations between Tehran and Washington has been made, but a peace agreement is still a long way off. There was a lack of macroeconomic and fundamental backdrop on Monday. Despite the prolonged downward movement, the upward trend is still maintained, as indicated by the trend line.
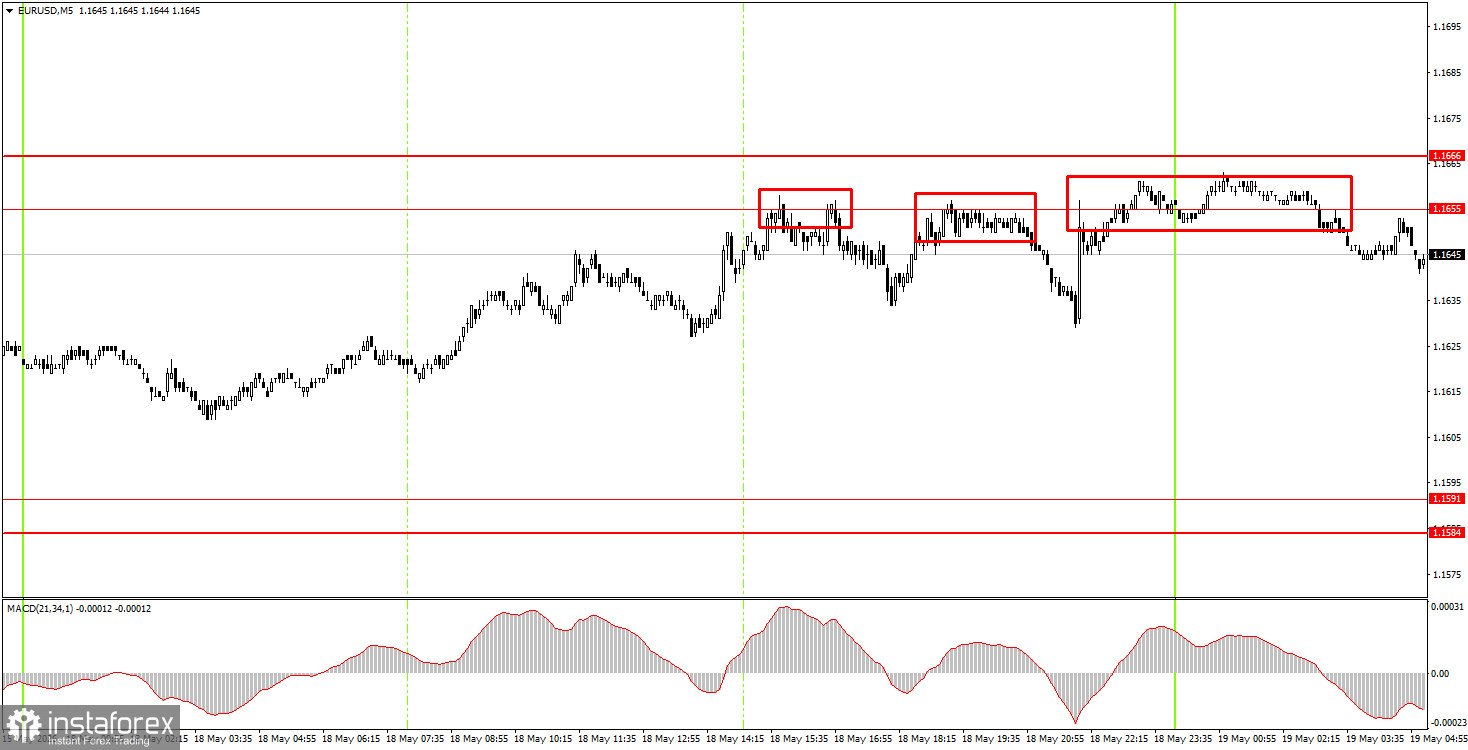
On the 5-minute timeframe, three trading signals were generated on Monday, each a price bounce from the area of 1.1655-1.1666. At this moment, none of these signals has led to a noticeable decline; however, theoretically, such a decline could occur today. This week may be under the banner of renewed de-escalation of the conflict in the Middle East, so the EUR/USD pair may continue to move higher.
On the hourly timeframe, the upward trend remains, and the euro has been correcting for an entire month. The rise of the US dollar has resumed, as the conflict in the Middle East was on the verge of escalation last week; however, we do not expect a significant long-term rise in the US dollar. The market continues to largely ignore fundamentals and macroeconomics.
On Tuesday, novice traders may open short positions targeting 1.1584-1.1591 if the price bounces again from the 1.1655-1.1666 area. Long positions can be considered if the price consolidates above the 1.1655-1.1666 area, targeting 1.1745-1.1754.
On the 5-minute timeframe, the following levels should be considered: 1.1354-1.1363, 1.1413, 1.1455-1.1474, 1.1527-1.1531, 1.1584-1.1591, 1.1655-1.1666, 1.1745-1.1754, 1.1830-1.1837, 1.1899-1.1908. On Tuesday, the Eurozone event calendar is completely empty, while in the US, an ADP report on the labor market will be released in a weekly release. We do not expect any market reaction to this report.
Price levels (areas) of support and resistance – levels that are targets when opening purchases or sales, or sources of signals.
Red lines – channels or trend lines that display the current trend and indicate which direction is preferable to trade now.
MACD indicator (14, 22, 3) – histogram and signal line – a supporting indicator that can also be used as a source of signals.
Important speeches and reports (contained in the news calendar) can significantly influence the movement of the currency pair. Therefore, during their release, trading should be done as cautiously as possible, or one should exit the market to avoid a sharp price reversal against the preceding movement.
Beginners trading in the Forex market should remember that not every trade can be profitable. Developing a clear strategy and effective money management are key to long-term trading success.
¡Los informes analíticos de InstaForex lo mantendrá bien informado de las tendencias del mercado! Al ser un cliente de InstaForex, se le proporciona una gran cantidad de servicios gratuitos para una operación eficiente.


