 Permanecer
Condiciones de negociación
Products
Herramientas



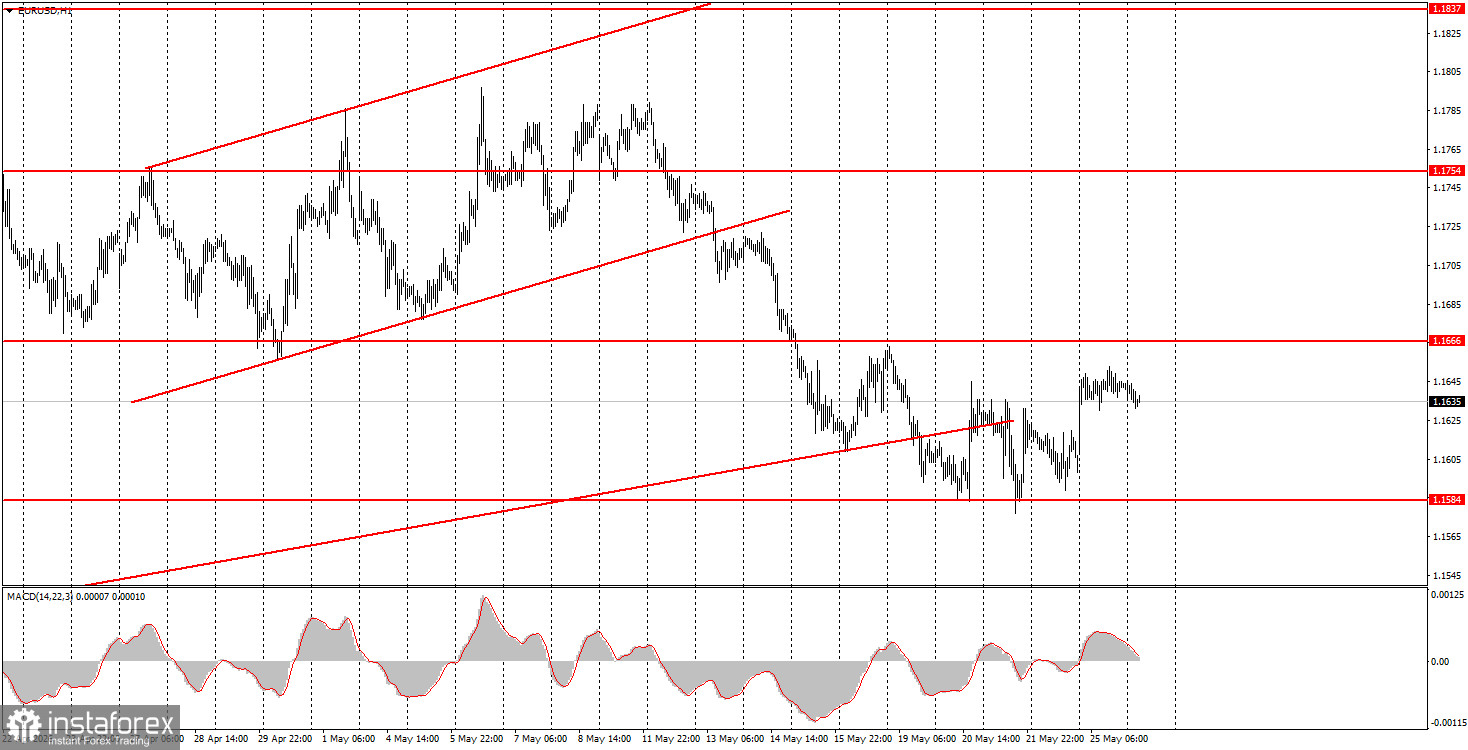
The EUR/USD currency pair traded predominantly sideways on Monday with low volatility. The trading session opened with a small gap upwards, followed shortly by another 20-pip spike during the Asian trading session. Essentially, that marked the end of all movements for the day. For one, this is understandable since there were no macroeconomic reports or fundamental events scheduled for Monday. On the other hand, the market has been ignoring such events for about three months now, focusing solely on geopolitics. However, even geopolitics is starting to wear thin. Over the weekend, Donald Trump once again announced that a deal with Iran is close, which would lead to the reopening of the Strait of Hormuz. Since then, no confirming information has come from either Tehran or Pakistan. Thus, traders once again feel that the U.S. president may have misled them, presenting wishes as reality. Therefore, the market's reaction to what appeared to be a resolution of the conflict was minimal.
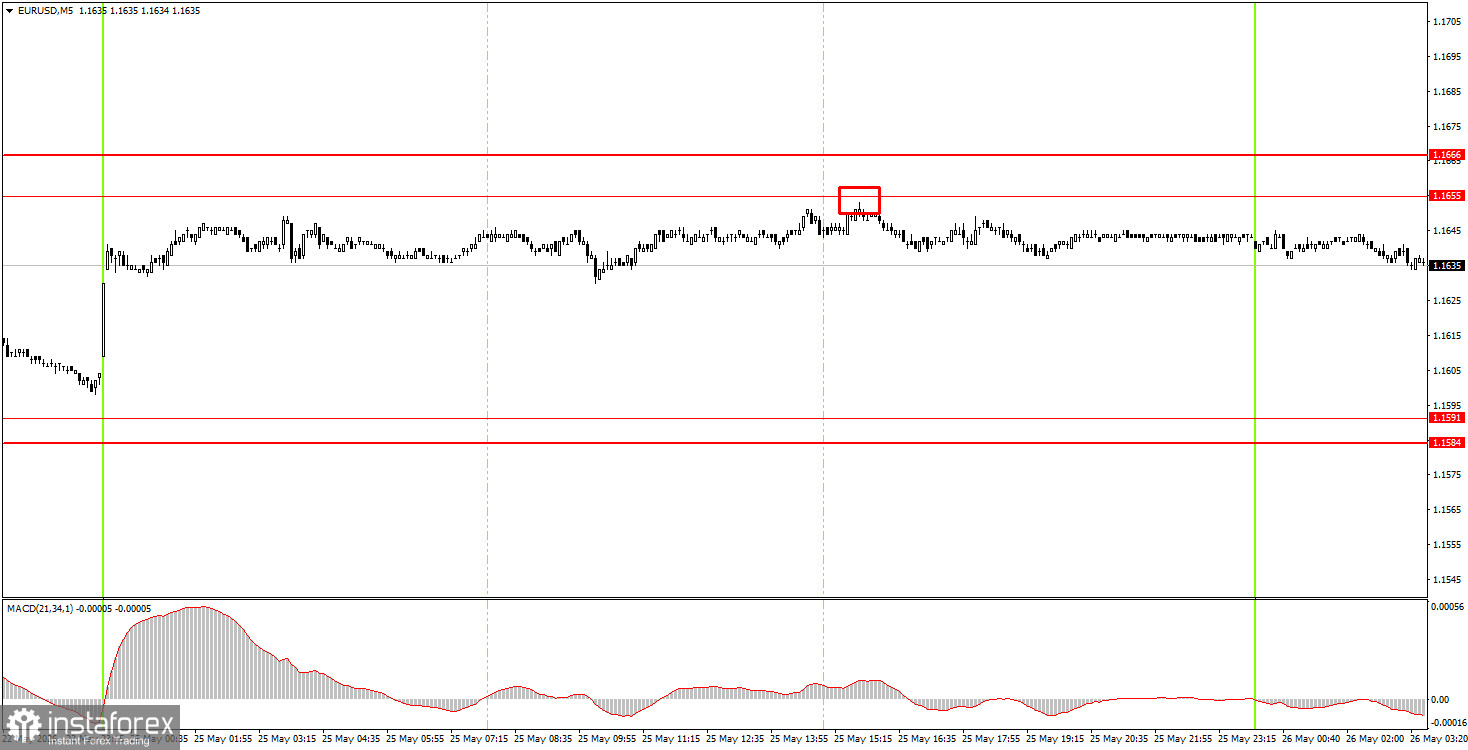
On the 5-minute timeframe, only one trading signal was formed on Monday, which is unusual given the overall lack of activity. Nevertheless, at the start of the American trading session, the pair rebounded from 1.1655 with minimal deviation, allowing traders to open short positions. The decline in the quotes may continue today, but the reasons for that are currently lacking.
On the hourly timeframe, the euro has been in a corrective phase for the past month. The U.S. currency's resurgence continued as the conflict in the Middle East was on the brink of escalation last week, but we still do not anticipate prolonged strength in the American currency. The market continues to largely ignore fundamentals and macroeconomics, while geopolitics swings the EUR/USD pair up and down.
On Tuesday, novice traders may stay in short positions targeting 1.1584-1.1591, as the price has bounced from the 1.1655-1.1666 area. New long positions can be considered upon the price consolidating above the 1.1655-1.1666 area, with targets at 1.1745-1.1754.
On the 5-minute timeframe, levels to watch include 1.1354-1.1363, 1.1413, 1.1455-1.1474, 1.1527-1.1531, 1.1584-1.1591, 1.1655-1.1666, 1.1745-1.1754, 1.1830-1.1837, and 1.1899-1.1908. On Tuesday, there are again no significant events or reports scheduled in the European Union or the U.S., and the market will once more await geopolitical information and confirmations of Trump's weekend statements.
Price levels (areas) of support and resistance – levels that are targets when opening purchases or sales, or sources of signals.
Red lines – channels or trend lines that display the current trend and indicate which direction is preferable to trade now.
MACD indicator (14, 22, 3) – histogram and signal line – a supporting indicator that can also be used as a source of signals.
Important speeches and reports (contained in the news calendar) can significantly influence the movement of the currency pair. Therefore, during their release, trading should be done as cautiously as possible, or one should exit the market to avoid a sharp price reversal against the preceding movement.
Beginners trading in the Forex market should remember that not every trade can be profitable. Developing a clear strategy and effective money management are key to long-term trading success.
¡Los informes analíticos de InstaForex lo mantendrá bien informado de las tendencias del mercado! Al ser un cliente de InstaForex, se le proporciona una gran cantidad de servicios gratuitos para una operación eficiente.


