 Permanecer

Condiciones de negociación
Products
Herramientas


Some traders briefly took President Donald Trump at his word about an imminent peace deal with Iran, but last week turned out to be one of the worst so far this year for spot ETFs on Bitcoin and Ethereum. Outflows from Bitcoin ETFs totaled $1.26 billion, a large amount that demonstrates institutional investors are continuing to cut exposure to the primary crypto asset.

Ethereum lagged but also saw notable redemptions: about $216 million left the market over the week, following a run of eight consecutive down days recorded earlier. The weekly picture fits a single narrative: large capital is using any local price rebounds to take profits, with no sign of a durable reversal. BlackRock, which twice moved hundreds of millions of dollars in Bitcoin and Ethereum into Coinbase Prime during the week, amplified selling pressure.
At the other end of the market, the altcoin ETF complex tells a different story. The leader last week was HYPE, which attracted $72.4 million and became the main beneficiary of the capital reallocation. It was followed by inflows into XRP ETFs of $22 million and SOL ETFs of $15.6 million. Other tokens gathered token sums: DOGE $861,000; LINK $517,000; LTC $260,000; HBAR $240,000. AVAX and DOT showed no movement. Total inflows into altcoin ETFs amounted to just over $111 million — less than 9 percent of the amount that simultaneously exited Bitcoin ETFs. That contrast makes clear that this was not a rotation from Bitcoin into altcoins but a broader withdrawal of large amounts of money from the crypto market.
Weekly figures sit inside a worrying structural context. Regulatory uncertainty persists: the CLARITY Act risks being pushed from June to July due to a congested congressional schedule, and lawmakers have only eight working weeks left before their August recess. Bitcoin continues to trade with a high correlation to the Nasdaq, losing some of its appeal as an independent asset. In this environment, Brian Armstrong's manifesto listing eight "unfinished tasks" for the financial system reads both as a strategic roadmap and as pressure on regulators: infrastructure for a new financial order is being built, but capital is waiting for clear rules.
Trading recommendations
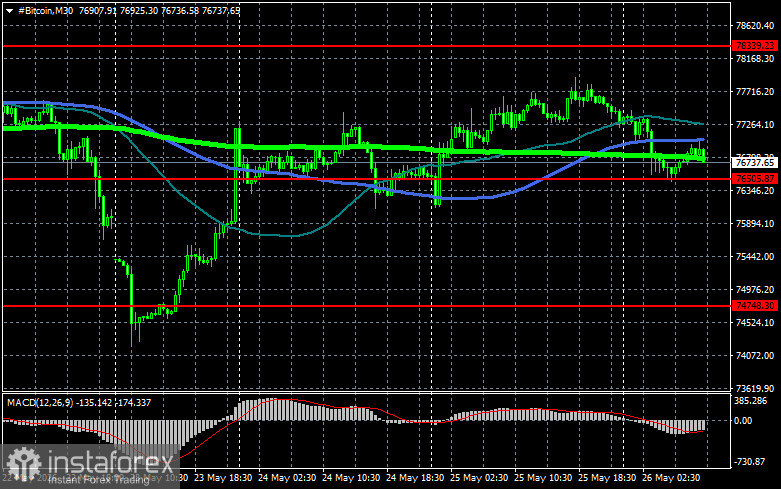
Buyers of BTC are targeting a return to $78,400, a level that would open a direct path to $80,100 and then to $81,700. A breach above $81,700 would signal attempts to restore the bull market. On the downside, buyers are expected at $76,500. A drop below that area could quickly take Bitcoin toward $74,700, with a further target at $73,100.
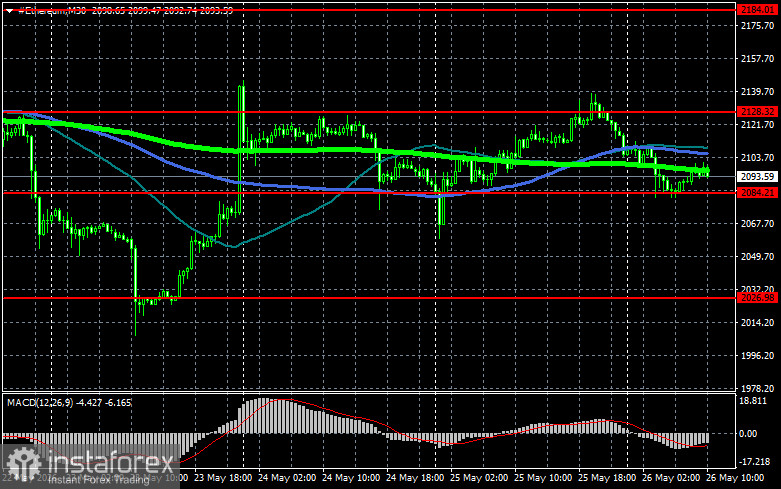
As for Ethereum, a clear hold above $2,128 would open a direct route to $2,184. The further target is the high near $2,254. A break above that level would indicate strengthening bullish sentiment and renewed buyer interest. On the downside, buyers are expected at $2,084. A fall below that point could rapidly send Ethereum toward $2,026, with a deeper target at $1,969.
What we see on the chart:
- Red lines indicate support and resistance levels where either a price slowdown or active growth is expected;
- Green lines indicate the 50-day moving average;
- Blue lines indicate the 100-day moving average;
- Light green lines indicate the 200-day moving average.
A crossover, or a price test of moving averages, typically either halts the move or sparks fresh market momentum.
¡Los informes analíticos de InstaForex lo mantendrá bien informado de las tendencias del mercado! Al ser un cliente de InstaForex, se le proporciona una gran cantidad de servicios gratuitos para una operación eficiente.


