 Permanecer
Condiciones de negociación
Products
Herramientas


The GBP/USD pair also moved with low volatility on Wednesday due to the lack of important geopolitical, fundamental, and macroeconomic events. On Thursday night, the decline of the British pound after breaching the ascending trend line accelerated slightly, but the strengthening of the U.S. dollar amid another ceasefire breach in the Middle East should not surprise anyone. The dollar remains in a more advantageous position, as there is still no sign of a long-lasting and sustainable ceasefire in the Middle East. From our perspective, the American currency will not form a trend similar to what everyone saw in February and March, but geopolitical factors currently support it more than the British pound. This week, the UK calendar of events is completely empty, while the U.S. will release only a few reports that traders can easily ignore. Thus, technical analysis and geopolitics will remain in the foreground.
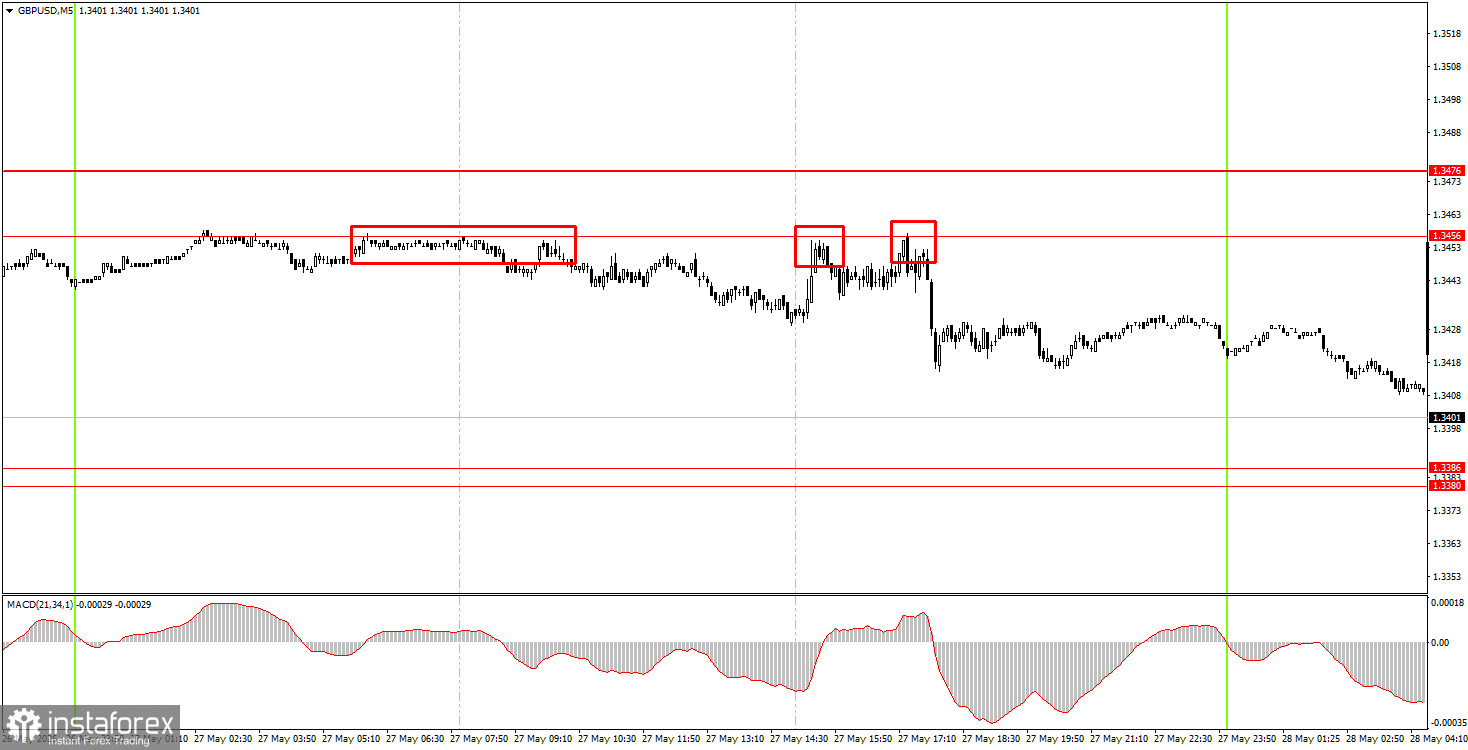
In the 5-minute timeframe on Wednesday, three trading signals were generated despite low volatility. The price bounced off the 1.3456 level three times, each time with perfect accuracy. All three signals duplicated each other, allowing novice traders to open one short position. By Thursday morning, the signal was fully realized, as the GBP/USD pair reached the nearest target area at 1.3380-1.3386.
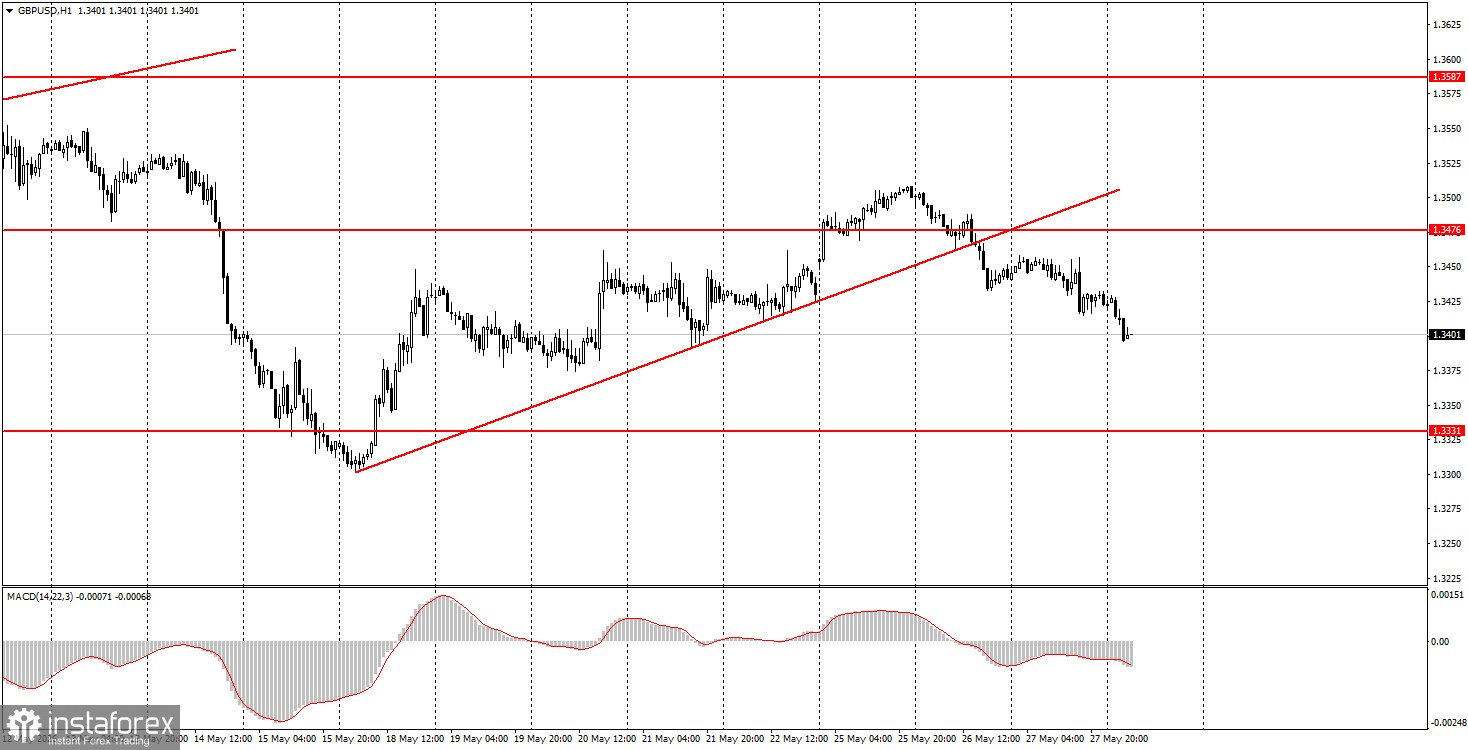
On the hourly timeframe, the GBP/USD pair began to form an upward trend, only to end it immediately as geopolitics deteriorated again. However, without the resumption of full-scale war in the Middle East, the dollar cannot expect growth like in February and March. Individual events may still provoke a strengthening (as seen on Tuesday), but we do not believe the market will trigger a new wave of risk aversion.
On Thursday, novice traders can open new short positions with a target of 1.3319-1.3331 if the price consolidates below the 1.3380-1.3386 range. A bounce from the area of 1.3380-1.3386 will allow for opening long positions with a target of 1.3456-1.3476. It should be remembered that volatility is low at this time.
On the 5-minute timeframe, levels to consider are 1.3175-1.3180, 1.3259-1.3267, 1.3319-1.3331, 1.3380-1.3386, 1.3456-1.3476, 1.3587-1.3598, 1.3631-1.3641, 1.3695, and 1.3741-1.3751. In the UK, the calendar of events remains empty today, while in the U.S., several reports will be released, among them the PCE index and durable goods orders.
Price levels (areas) of support and resistance – levels that are targets when opening purchases or sales, or sources of signals.
Red lines – channels or trend lines that display the current trend and indicate which direction is preferable to trade now.
MACD indicator (14, 22, 3) – histogram and signal line – a supporting indicator that can also be used as a source of signals.
Important speeches and reports (contained in the news calendar) can significantly influence the movement of the currency pair. Therefore, during their release, trading should be done as cautiously as possible, or one should exit the market to avoid a sharp price reversal against the preceding movement.
Beginners trading in the Forex market should remember that not every trade can be profitable. Developing a clear strategy and effective money management are key to long-term trading success.
¡Los informes analíticos de InstaForex lo mantendrá bien informado de las tendencias del mercado! Al ser un cliente de InstaForex, se le proporciona una gran cantidad de servicios gratuitos para una operación eficiente.


