 Permanecer

Condiciones de negociación
Products
Herramientas


Bitcoin and Ethereum are finally showing signs of resuming their downward trend, having lost 12% and 20%, respectively, over the past few weeks. There are liquidity pools below that both cryptocurrencies will likely pass through completely. Recall that we have repeatedly warned in recent weeks that any rise in Ethereum or Bitcoin is, by definition, a correction, and one should expect the resumption of the main trend.
Meanwhile, experts continue to signal a capital outflow from ETFs, which perfectly reflects the decline in demand for cryptocurrencies among institutional traders. Simply put, large players do not believe in Bitcoin's further growth, given the conflict in the Middle East and the highly probable tightening of the Federal Reserve's monetary policy in 2026. It should be noted that the last "bullish" trend in Bitcoin occurred during a period of market expectations of Fed rate cuts. It began in the fall of 2022, when inflation in the U.S. started to slow, which immediately fostered expectations of a reduction in the key rate by the American central bank.
Now, the situation is the opposite. Inflation in the U.S. has risen by 1.4% in just two months and may continue to rise. The break-even area for many traders who had previously opened longs was around $78,000-$80,000, but they did not wait for a new bullish trend. Additionally, the last "halving," contrary to popular belief, did not lead to sustainable growth for Bitcoin. Time passes, and the patterns and models that previously ensured significant growth no longer work. It is noteworthy that 2025 was the first year in Bitcoin's history in which, after a "halving," Bitcoin depreciated rather than increased in value. Thus, we still do not see any basis for a new upward trend or signs of an end to the downward trend.
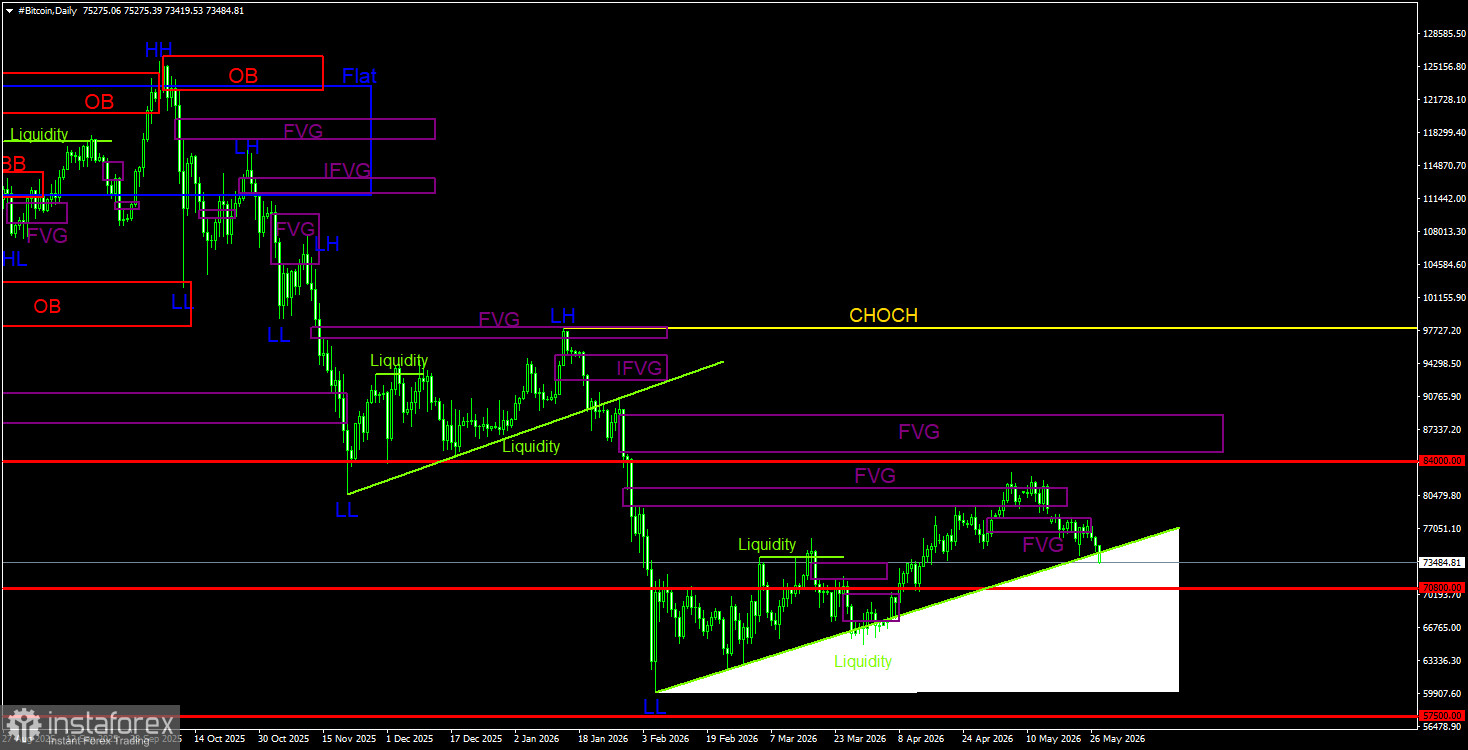
Bitcoin continues to form a full-fledged downward trend and a correction against it. We continue to expect a decline, targeting $57,500 (the 61.8% Fibonacci level from the three-year upward trend), and there are still no signs of a long-term upward trend. Among the areas of interest (POI), we can currently only highlight the nearest "bearish" FVG on the daily timeframe, located in the range of $79,300 - $81,200. In this area, a sell signal was generated (on the second attempt) and confirmed on the hourly timeframe. Thus, in the near future, we are set for the resumption of the downward trend, and bearish patterns remain a priority.
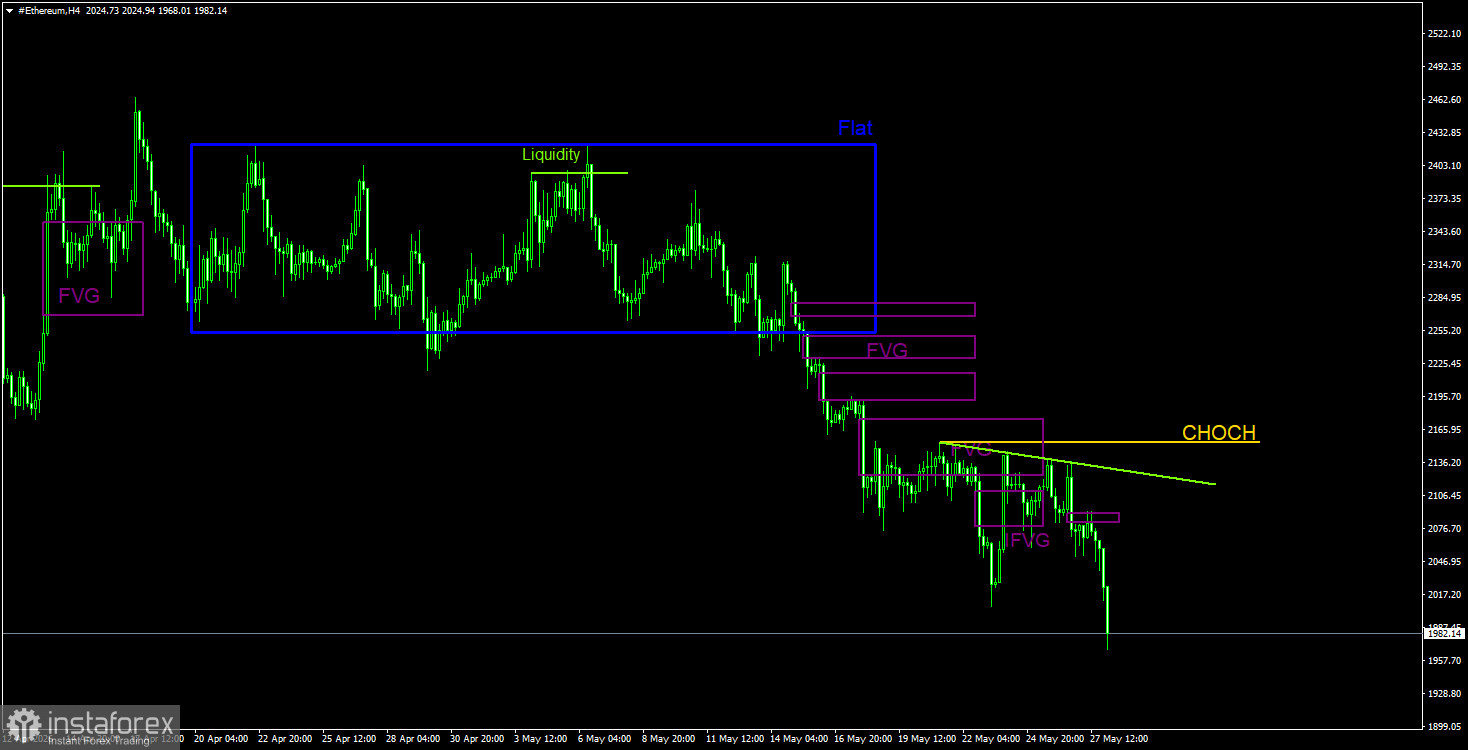
On the daily timeframe, the formation of a downward trend continues, which is likely to have resumed after a three-month correction. Ethereum may continue to decline in the near term, as signs of the end of the three-month correction are increasingly appearing both for Ethereum and Bitcoin. On the daily timeframe, no new patterns have been formed recently, as movements remain quite weak. On the 4-hour timeframe, a downward trend has been established, so bearish patterns can be used to open short positions. The target remains the level of $1,742. We cannot consider bullish patterns and buy signals safe, as both cryptocurrencies are aiming for a new phase of a downward trend.
CHOCH – Change of character in the trend structure.
Liquidity – Stop Loss and pending orders that market makers use to accumulate their positions.
FVG – Fair Value Gap. Price moves through such areas very quickly, indicating a complete absence of one side in the market. Subsequently, the price tends to return and react from such areas in continuation of the main trend.
IFVG – Inverted Fair Value Gap. After returning to such an area, the price does not react; instead, it impulsively breaks through and then tests it from the other side.
OB – Order Block. The candlestick on which the market maker opened a position aimed at taking liquidity to form their own position in the opposite direction.
¡Los informes analíticos de InstaForex lo mantendrá bien informado de las tendencias del mercado! Al ser un cliente de InstaForex, se le proporciona una gran cantidad de servicios gratuitos para una operación eficiente.


