 Permanecer
Condiciones de negociación
Products
Herramientas


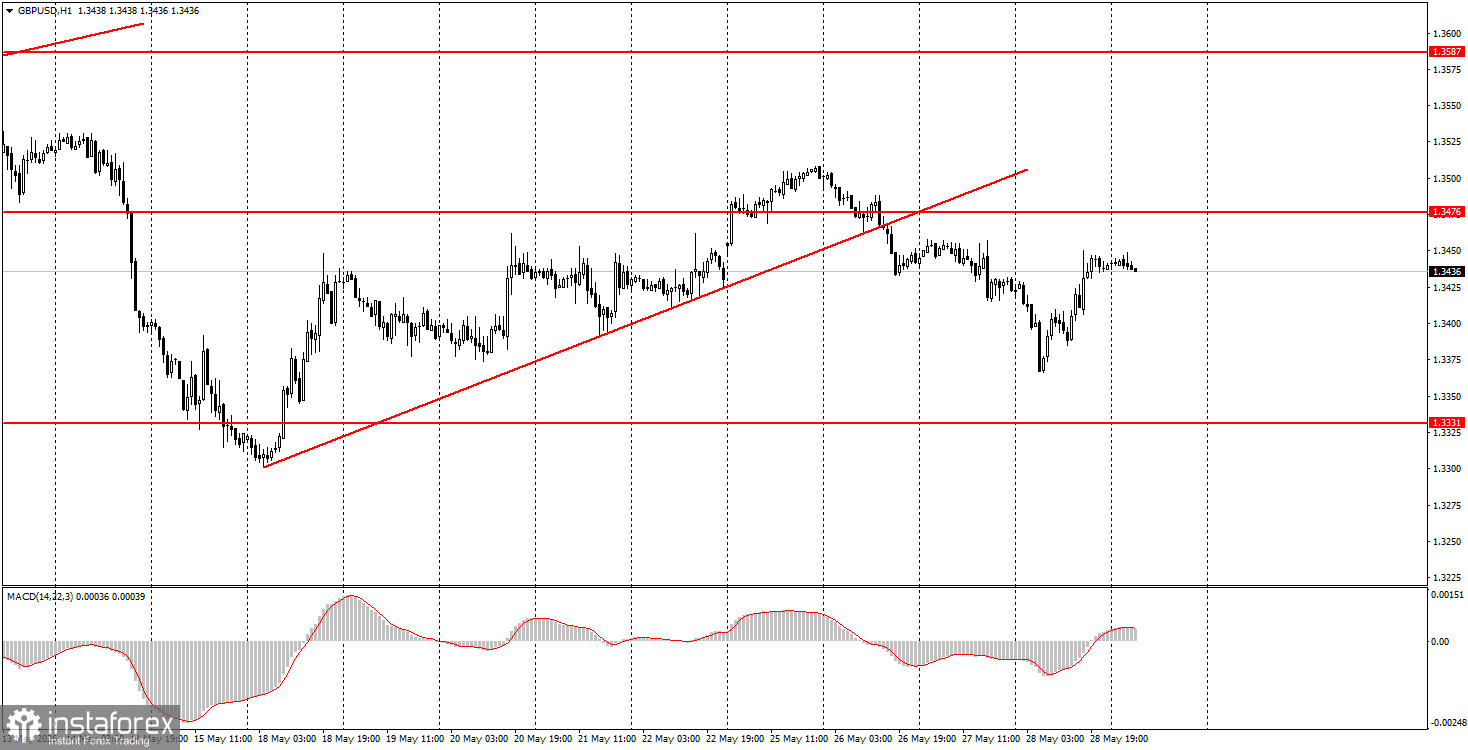
The GBP/USD pair also saw a drop followed by a rise on Thursday. Since all key events of the day concerned either geopolitics or the U.S., it is not surprising that the EUR/USD and GBP/USD pairs moved almost identically. However, there is no flat market for the British pound. The GBP/USD trend is downward after the price broke below the ascending trendline. Given that the geopolitical situation has not improved this week, with Iran and the U.S. having already violated the ceasefire at least twice and with no sign of an agreement between them, further moderate strengthening of the dollar is quite logical. Will there be grounds for this on Friday? Quite possibly, especially if disappointing information comes from the Middle East. At this time, most factors are not on the British currency's side.
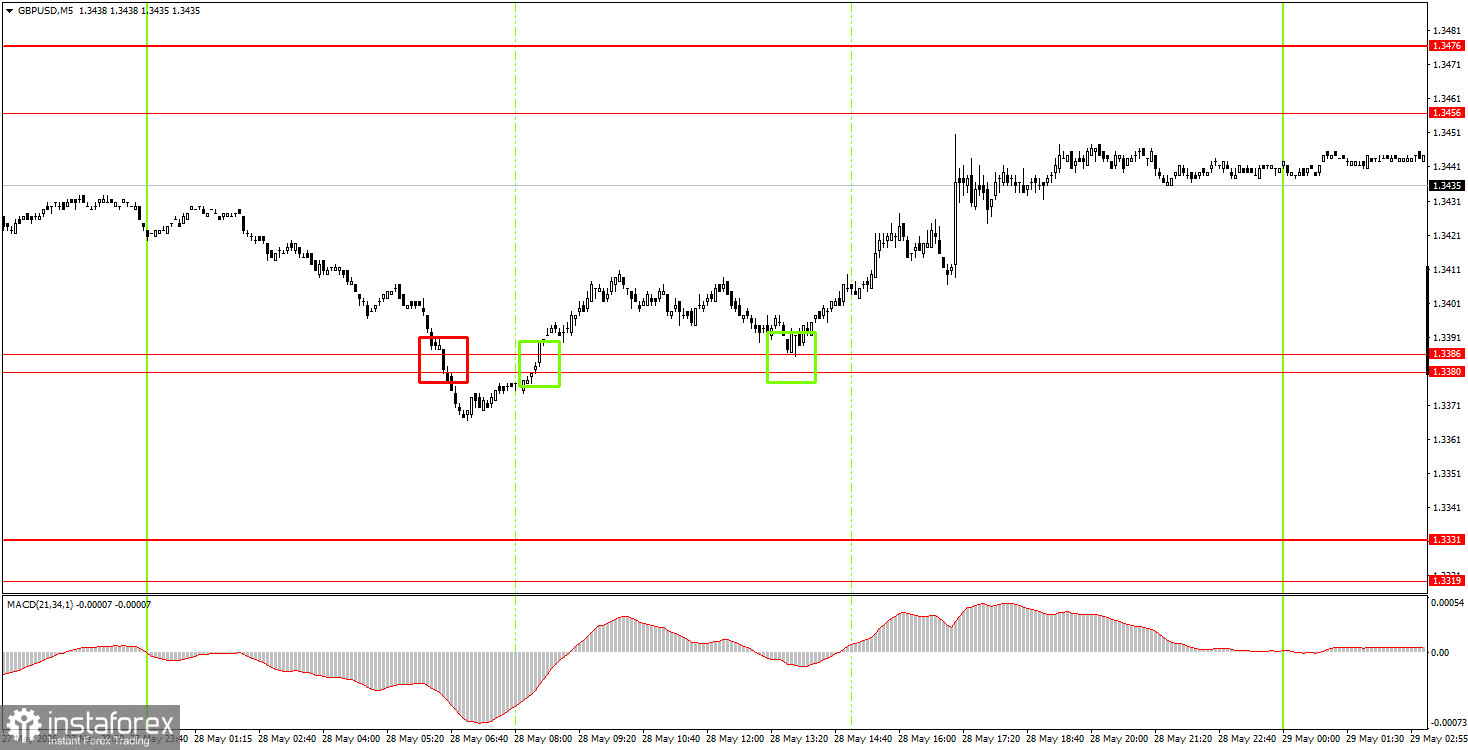
In the 5-minute timeframe on Thursday, a total of 3 trading signals were generated. The first sell signal generated during the Asian trading session proved false. However, the pair initially breached the 1.3380-1.3386 area and subsequently bounced above it. As a result, novice traders had two opportunities to open long positions, which resulted in profits of around 40 pips by the end of the day.
On the hourly timeframe, the GBP/USD pair continues to establish a new downward trend amid worsening geopolitical conditions. However, without a resumption of full-scale war in the Middle East, the dollar cannot expect to see growth like it did in February and March. Specific events may still trigger its strengthening (as seen this week), but we do not believe that the market will start a new wave of risk aversion.
On Friday, novice traders may open short positions targeting 1.3380-1.3386 if the price bounces from the 1.3456-1.3476 area. If the price consolidates above the 1.3456-1.3476 area, long positions can be opened with a target of 1.3587-1.3598.
On the 5-minute timeframe, trading levels to consider are 1.3175-1.3180, 1.3259-1.3267, 1.3319-1.3331, 1.3380-1.3386, 1.3456-1.3476, 1.3587-1.3598, 1.3631-1.3641, 1.3695, and 1.3741-1.3751. The calendar of events in the UK remains empty today, as does that in the U.S. Thus, hopes today may rest solely on geopolitical news. If there are no updates or they are weak, volatility throughout the day may also be extremely low.
Price levels (areas) of support and resistance – levels that are targets when opening purchases or sales, or sources of signals.
Red lines – channels or trend lines that show the current trend and indicate the preferred direction to trade now.
MACD indicator (14, 22, 3) – histogram and signal line – a supporting indicator that can also be used as a source of signals.
Important speeches and reports (contained in the news calendar) can significantly influence the movement of the currency pair. Therefore, during their release, trading should be done as cautiously as possible, or one should exit the market to avoid a sharp price reversal against the preceding movement.
Beginners trading in the Forex market should remember that not every trade can be profitable. Developing a clear strategy and effective money management are key to long-term trading success.
¡Los informes analíticos de InstaForex lo mantendrá bien informado de las tendencias del mercado! Al ser un cliente de InstaForex, se le proporciona una gran cantidad de servicios gratuitos para una operación eficiente.


