 Permanecer
Condiciones de negociación
Products
Herramientas


The EUR/USD currency pair continued to trade in exactly the same manner on Wednesday as in the past few weeks—showing low volatility, a minimal upward tilt, and movement close to a flat range. Under current circumstances, we wouldn't even focus on the upward slope, as 90% of the current movement is pure flat. Therefore, our conclusions remain the same as yesterday and the day before: the market continues to ignore the macroeconomic and fundamental backdrop, is unwilling to take risks with any positions, and is waiting for a resolution to the conflict between Iran and the US.
What does "waiting for a resolution" mean? The answer to this question is crucial, as this "resolution" could determine the fate of the dollar in the coming weeks or even months. In our view, the market has simply grown tired of the endless streams of geopolitical information, 90% of which are unverified or meaningless. For instance, it was reported yesterday that Washington is seemingly ready to make concessions on the "nuclear issue," but everyone understands there is no evidence to support this. Iran announced earlier this week that it was halting negotiations with the US; however, Trump intervened to prevent an Israeli attack on Lebanon, which logically suggests that negotiations should resume. Yet there is no information on this or on Iran's current position.
Instead, there are reports of yet another ceasefire violation in the Persian Gulf. The US struck the Iranian island of Qeshm, while Tehran retaliated with strikes on American bases in Kuwait and Bahrain. Understanding what is happening in the Middle East at present is nearly impossible. The parties to the conflict intermittently strike each other, claim to be in negotiations, report progress, or regress, talk about deals, and then deny any agreements. In this information soup, it is impossible to make sense of anything. Therefore, the market has drawn an obvious conclusion. If Tehran and Washington themselves cannot decide whether they are at war or seeking to sign a peace agreement, let them figure it out first, and then something concrete can be acted upon.
Thus, the market is waiting for such a resolution: either a full-scale resumption of hostilities following failed negotiations or the signing of a peace agreement and further discussions to resolve the crisis. For now, it can be said that there is still no scent of a peace agreement, and neither Iran nor the US wants to restart a full-scale war for understandable reasons. We believe that this form of conflict may continue for weeks, months, or even years. It is evident to everyone that Iran will not abandon its enriched uranium under any circumstances, nor will it relent on uranium enrichment. Moreover, Tehran understands that it is the US that is currently eager to end the war, declare victory, and calmly prepare for the elections. In blunt terms, the initiative is now in Tehran's hands, which is in no rush and does not agree to yet another burdensome deal from Donald Trump under the threat of coercion.
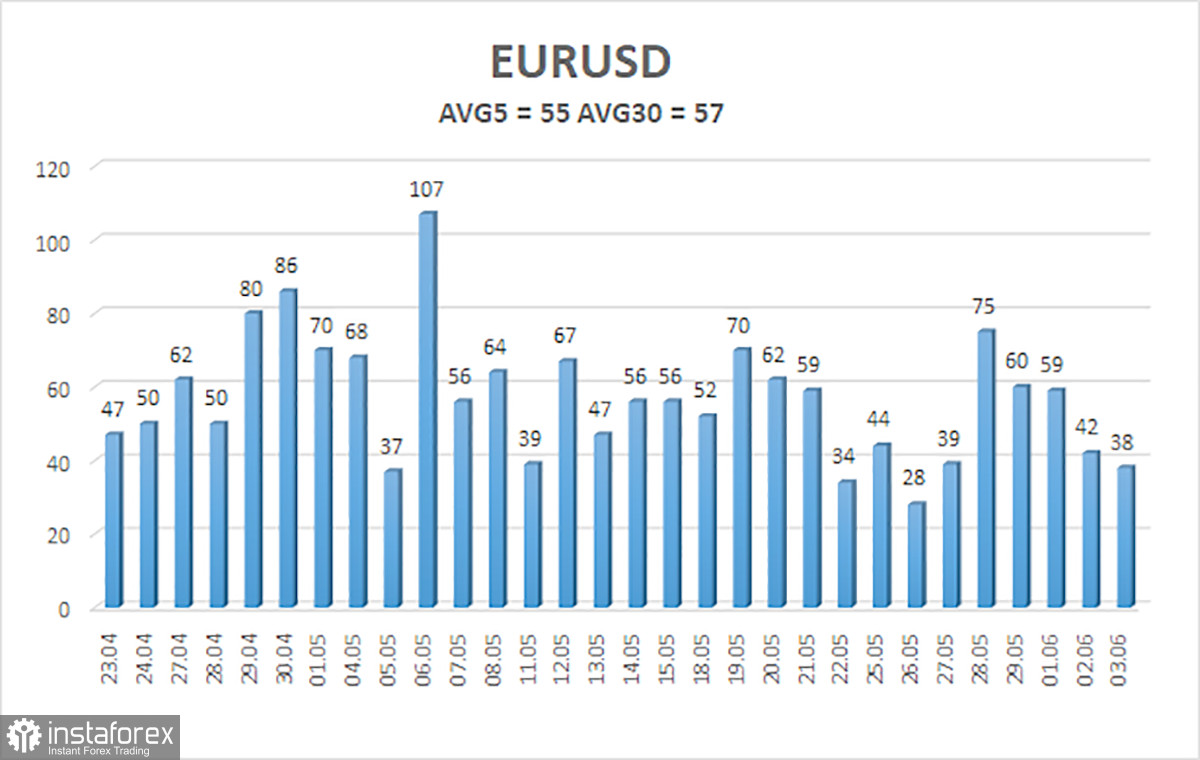
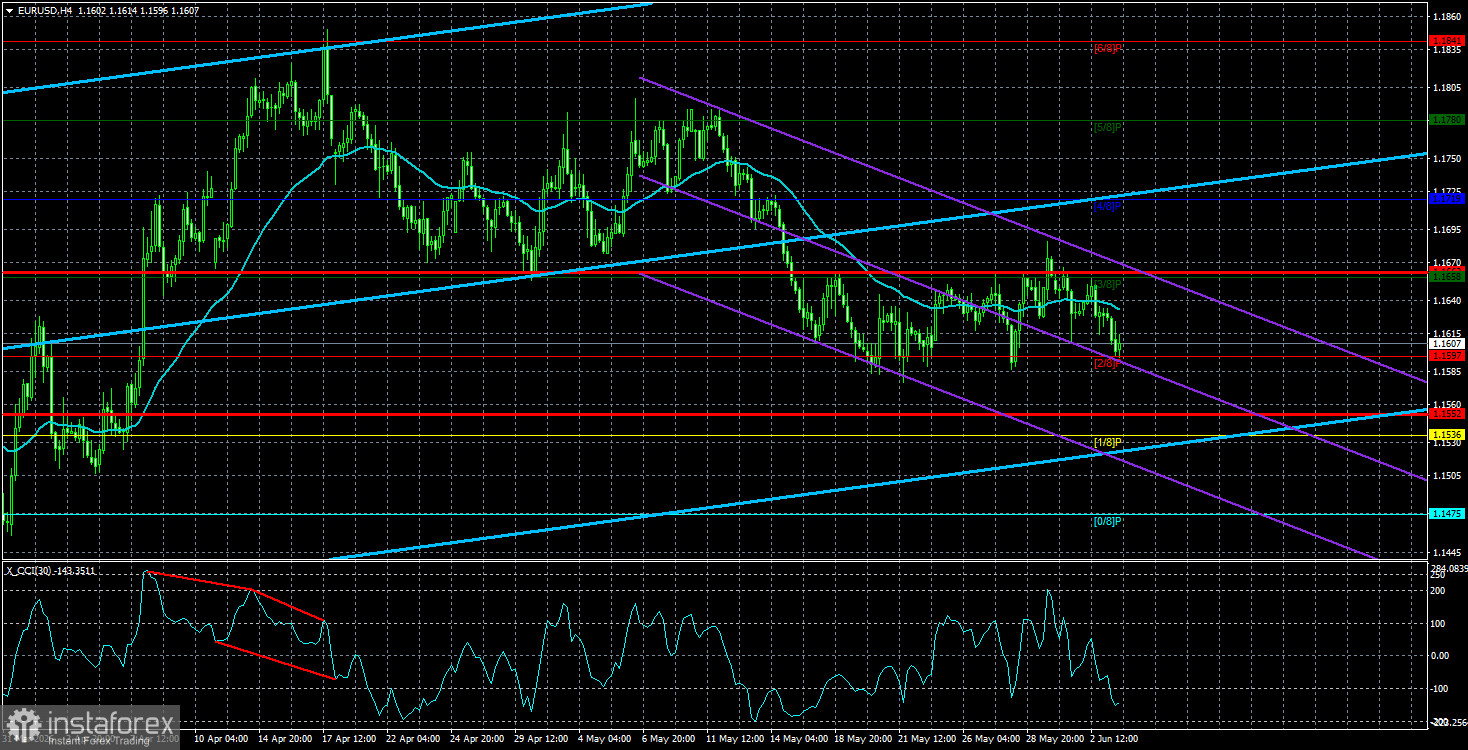
The average volatility of the EUR/USD currency pair over the last five trading days as of June 4 is 55 pips, characterized as "medium-low." We expect the pair to move between 1.1552 and 1.1662 on Thursday. The upper channel of linear regression has shifted upward, indicating a trend reversal toward bullish. In fact, the upward trend for 2025 could have resumed as early as March. The CCI indicator entered the overbought zone and formed two "bearish" divergences, warning of a downward correction that is still ongoing.
The EUR/USD pair continues its downward movement, which is presumably a correction within the broader upward trend. The global fundamental backdrop for the dollar remains extremely negative, with only geopolitical factors consistently providing support. If the price is below the moving average, short trades can be considered, targeting 1.1552 and 1.1536. Long positions become relevant when the price is above the moving average line, targeting 1.1719 and 1.1780. The market continues to distance itself from geopolitical factors, but in recent weeks, demand for the dollar has increased as hopes for peace in the Middle East have weakened. Currently, movements are weak, so it is advisable to trade on lower timeframes.
¡Los informes analíticos de InstaForex lo mantendrá bien informado de las tendencias del mercado! Al ser un cliente de InstaForex, se le proporciona una gran cantidad de servicios gratuitos para una operación eficiente.


