 Permanecer
Condiciones de negociación
Products
Herramientas


The GBP/USD currency pair continued to trade near the area of 1.3465-1.3480 on Thursday, where a significant and strong Senkou Span B line lies. The British pound has been unable to overcome this level for several consecutive weeks, with only rare exceptions. Overall, the movement dynamics are very similar to those of the EUR/USD pair. The market currently sees no grounds for either buying or selling. Geopolitics remains uncertain, and the macroeconomic backdrop continues to be ignored. Essentially, the nature of the current movement fully reflects the geopolitical context. Therefore, analyzing movements within the day, even on the hourly timeframe, makes little sense—it's flat. One can only wait for the pair to exit the sideways channel. This may not happen soon, as only geopolitical factors could push the price out of the current stalemate.
From a technical perspective, the downward trend began after breaching the trend line, but in recent weeks, the price has been tightly stuck between 1.3369-1.3377 and 1.3465-1.3480. Traders will not succeed in breaking the upper boundary of this channel, so we may soon observe movement toward the lower boundary. Geopolitics remains uncertain, so until the situation clarifies, the pound may remain within the sideways channel.
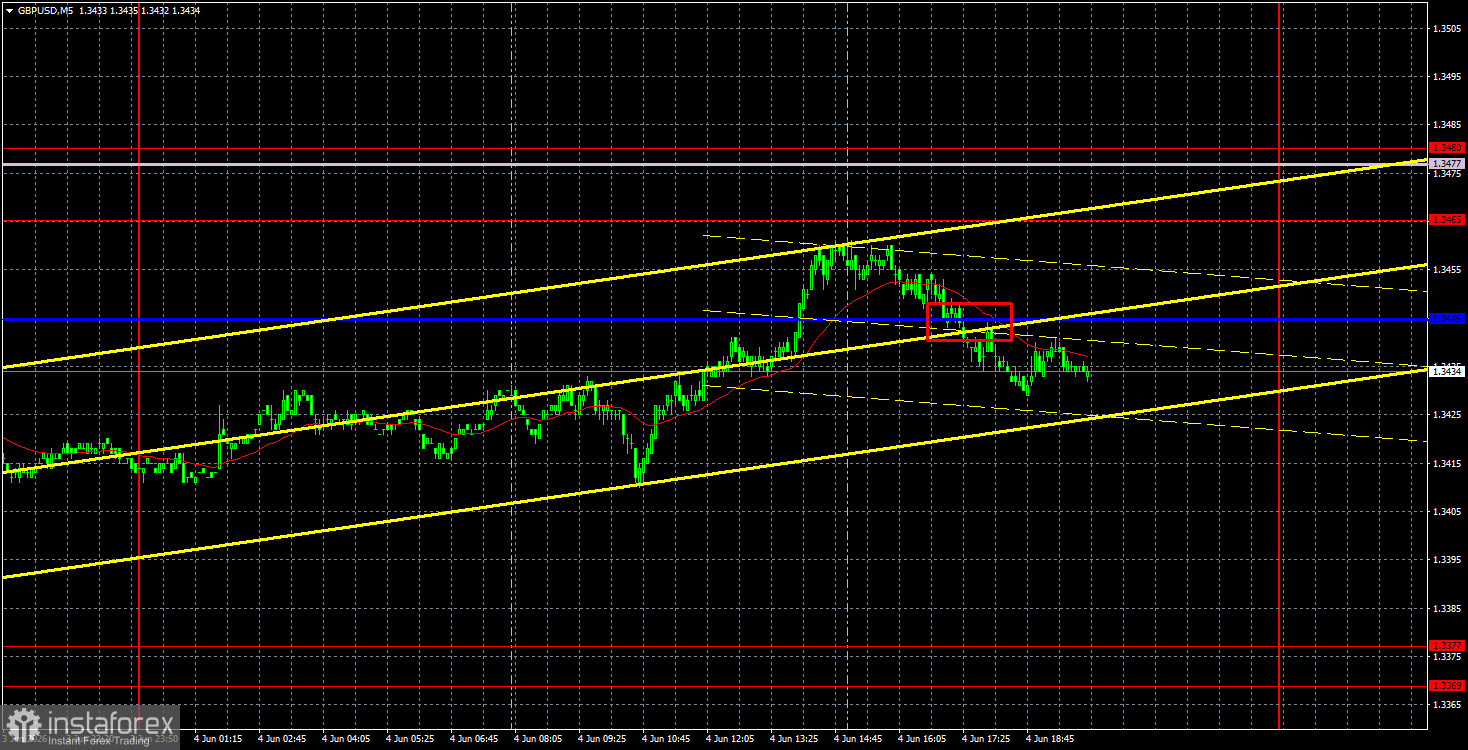
On the 5-minute timeframe on Thursday, there was one trading signal worth noting. During the American trading session, the pair dropped below the critical line, allowing traders to open short positions. Given the current volatility, expecting significant profits was naive, and the downward move effectively ended immediately after the signal was formed. The previous buy signal was not worth considering, as there was a resistance level at 1.3465, which was 20 pips higher.
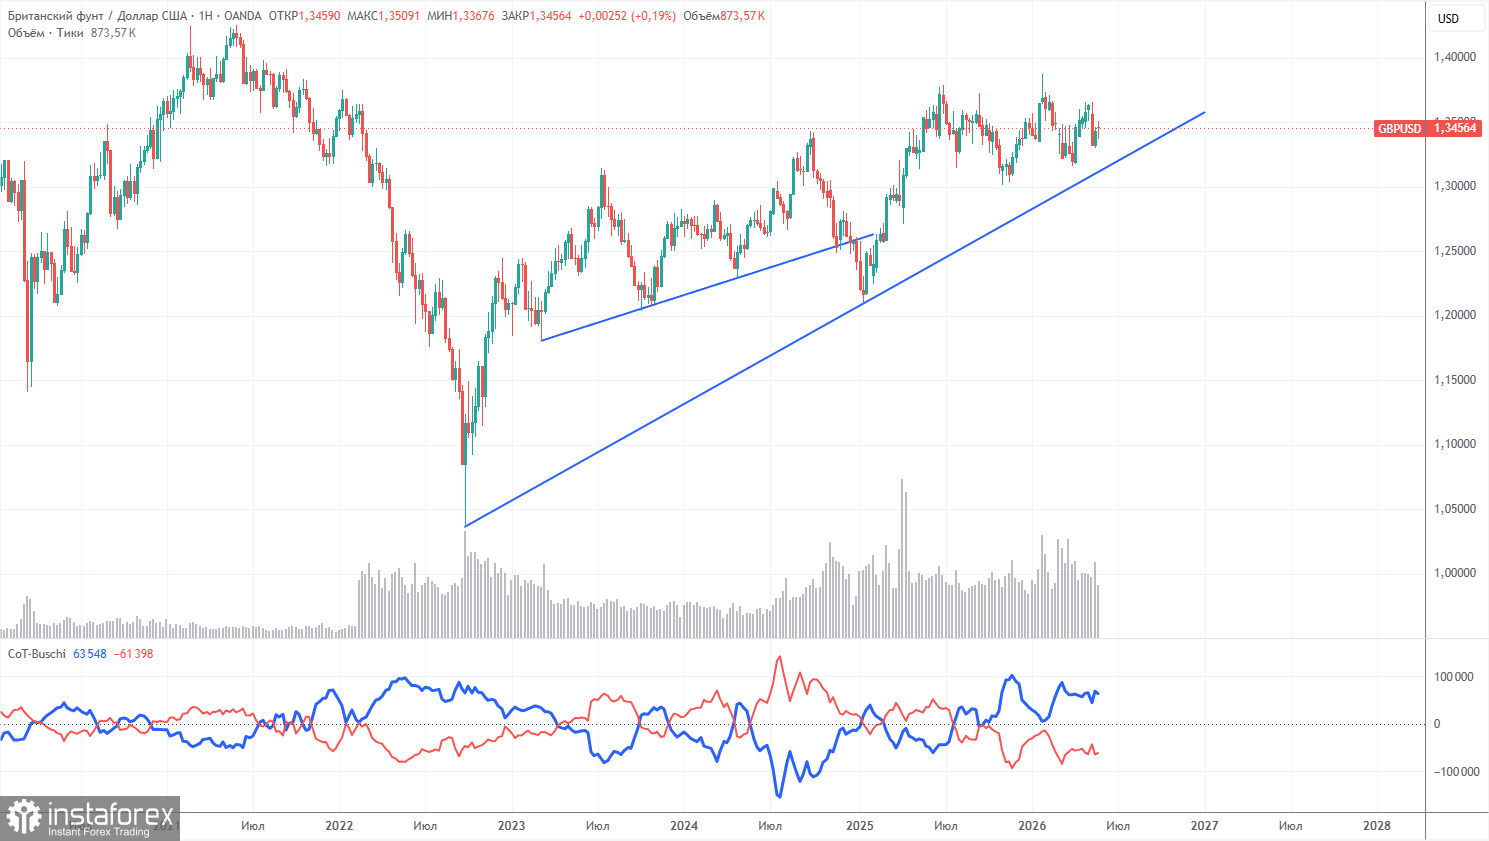
The COT reports for the British pound show that, in recent years, sentiment among commercial traders has been constantly shifting. The red and blue lines, which reflect the net positions of commercial and non-commercial traders, frequently intersect and are mostly close to the zero mark. Currently, the lines are diverging, with non-commercial traders continuing to dominate with... shorts. Given the events in the Middle East, it is no surprise that demand for riskier currencies is falling while demand for the dollar is rising.
In the long term, the dollar continues to decline due to Trump's policies, as evidenced by the weekly timeframe (illustration above). The trade war will persist in one form or another for a long time, and Trump's policies are aimed, both directly and indirectly, at weakening the American currency. However, geopolitical factors currently take precedence, providing significant support for the dollar. Since the conflict in the Middle East cannot be declared resolved, the US dollar may still see potential growth in the future. According to the latest COT report (as of May 26), the Non-Commercial group closed 10,100 buy contracts and 13,000 sell contracts. As a result, the net position of non-commercial traders increased by 3,100 contracts over the week.
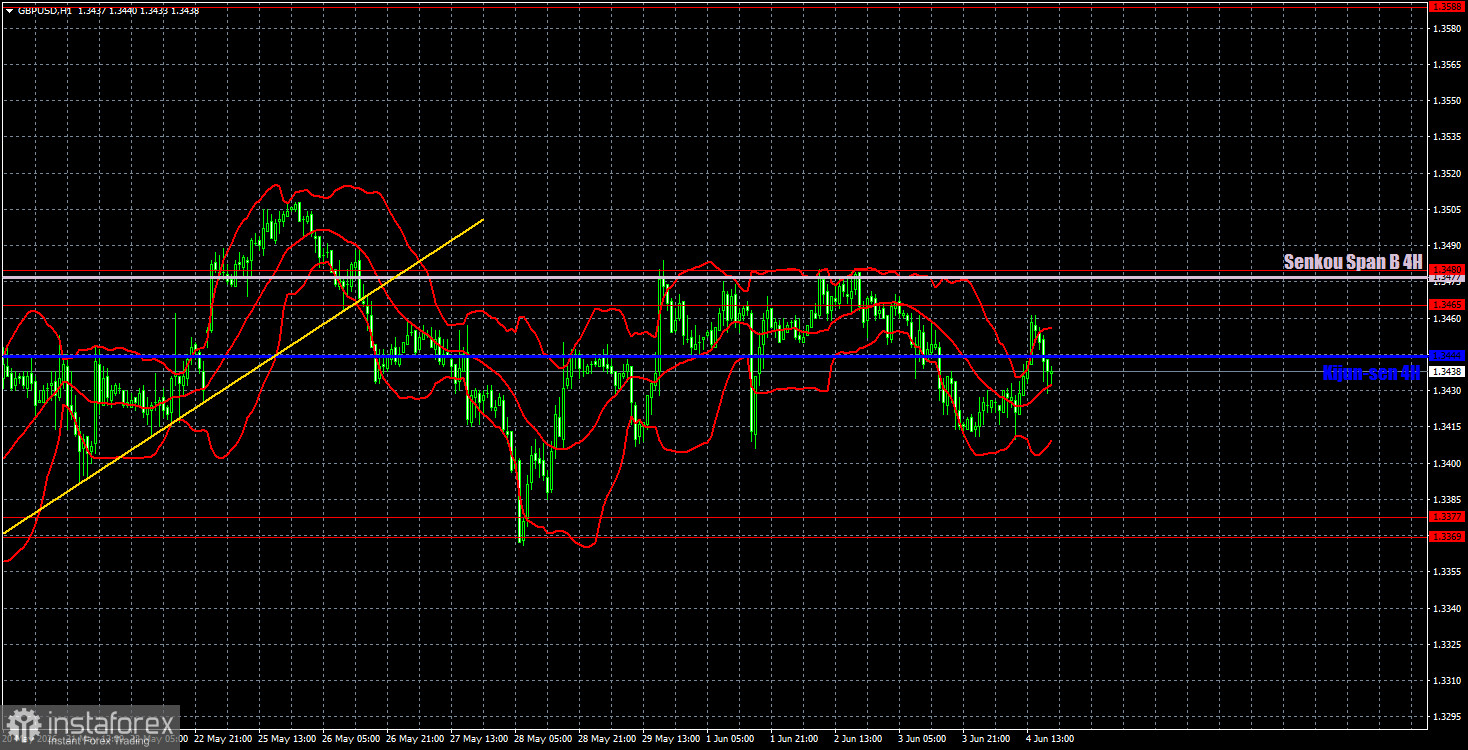
On the hourly timeframe, the GBP/USD pair has ended the upward trend due to renewed tensions around the Strait of Hormuz and in relations between Iran and the USA. The macroeconomic and fundamental background still has little impact on the pair's movements. We do not believe that without a real escalation of the conflict in the Middle East, the dollar will be able to show strong growth, and at this time, the euro and the pound are tightly stuck within sideways channels.
For June 5, we highlight the following important levels: 1.3096-1.3115, 1.3179-1.3187, 1.3369-1.3377, 1.3465-1.3480, 1.3588, 1.3671-1.3681, 1.3751-1.3763. The Senkou Span B line (1.3477) and Kijun-sen (1.3444) may also serve as signal sources. The Stop Loss level is recommended to be set at breakeven upon the price moving in the right direction by 20 pips. The Ichimoku indicator lines may move during the day, which should be taken into account when determining trading signals.
There are no important events or reports scheduled for Friday in the UK, while in the USA, important labor market and unemployment data will be released. These reports may well be ignored, but even if not, they are unlikely to allow the euro and the pound to exit their sideways channels.
Today, traders can consider short positions with targets of 1.3369-1.3377 if the price bounces from the 1.3465-1.3480 area. Long positions will become relevant if consolidation occurs above the 1.3465-1.3480 area, with a target of 1.3588.
¡Los informes analíticos de InstaForex lo mantendrá bien informado de las tendencias del mercado! Al ser un cliente de InstaForex, se le proporciona una gran cantidad de servicios gratuitos para una operación eficiente.


