 Permanecer
Condiciones de negociación
Products
Herramientas


The EUR/USD currency pair continued its weak decline on Thursday, with low volatility and uncertain prospects. The market ignored yet another important fundamental event, simply brushing aside the European Central Bank meeting, the rate hike, and Christine Lagarde's speech. As we warned, the market reaction was merely "for show." During the two-hour timeframe surrounding the ECB meeting, the euro was tossed back and forth by 10-15 pips, and that was it. Regarding the prospects for the US dollar, it is also rising very weakly, despite the full resumption of the conflict in the Middle East. Of course, negotiations between Tehran and Washington may resume tomorrow, but for now, we only hear Trump's statements about an impending new attack on Iran. Therefore, the dollar remains in a more advantageous position, but we still do not expect strong growth. The market appears reluctant to buy the dollar but has no other choice.
From a technical perspective, the downward trend has resumed, but whether it will continue is a big question. If Tehran and Washington miraculously sign a deal, demand for the US currency will decline. However, at present, the parties are much closer to resuming war, so the dollar remains strong across the market.
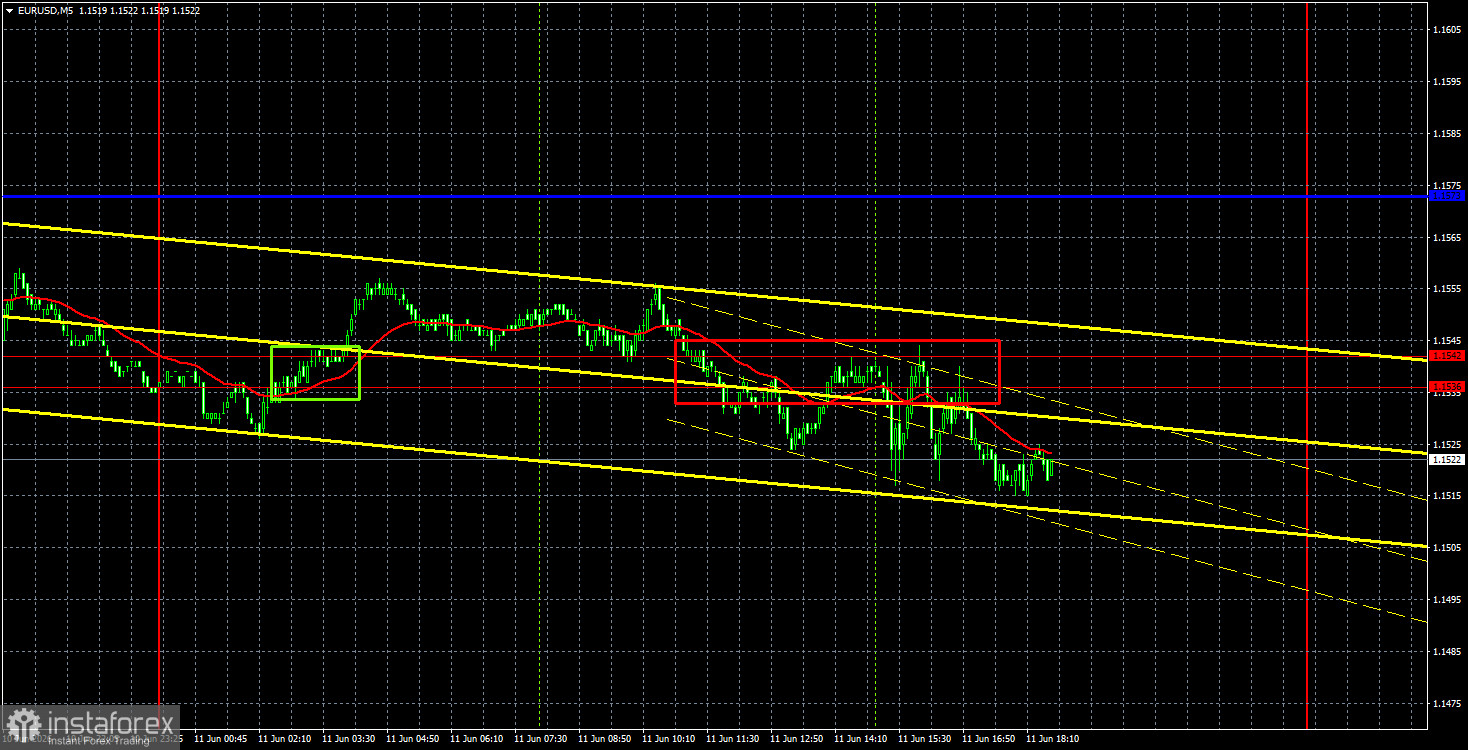
On the 5-minute timeframe on Thursday, movement was weak, but the pair still formed two trading signals. Early in the night, the price breached the 1.1536-1.1542 area but failed to advance significantly. During the European trading session, the price consolidated below the specified area and then bounced off it several times to confirm the move. Thus, traders had the opportunity to open short positions, which can be carried over to Friday.
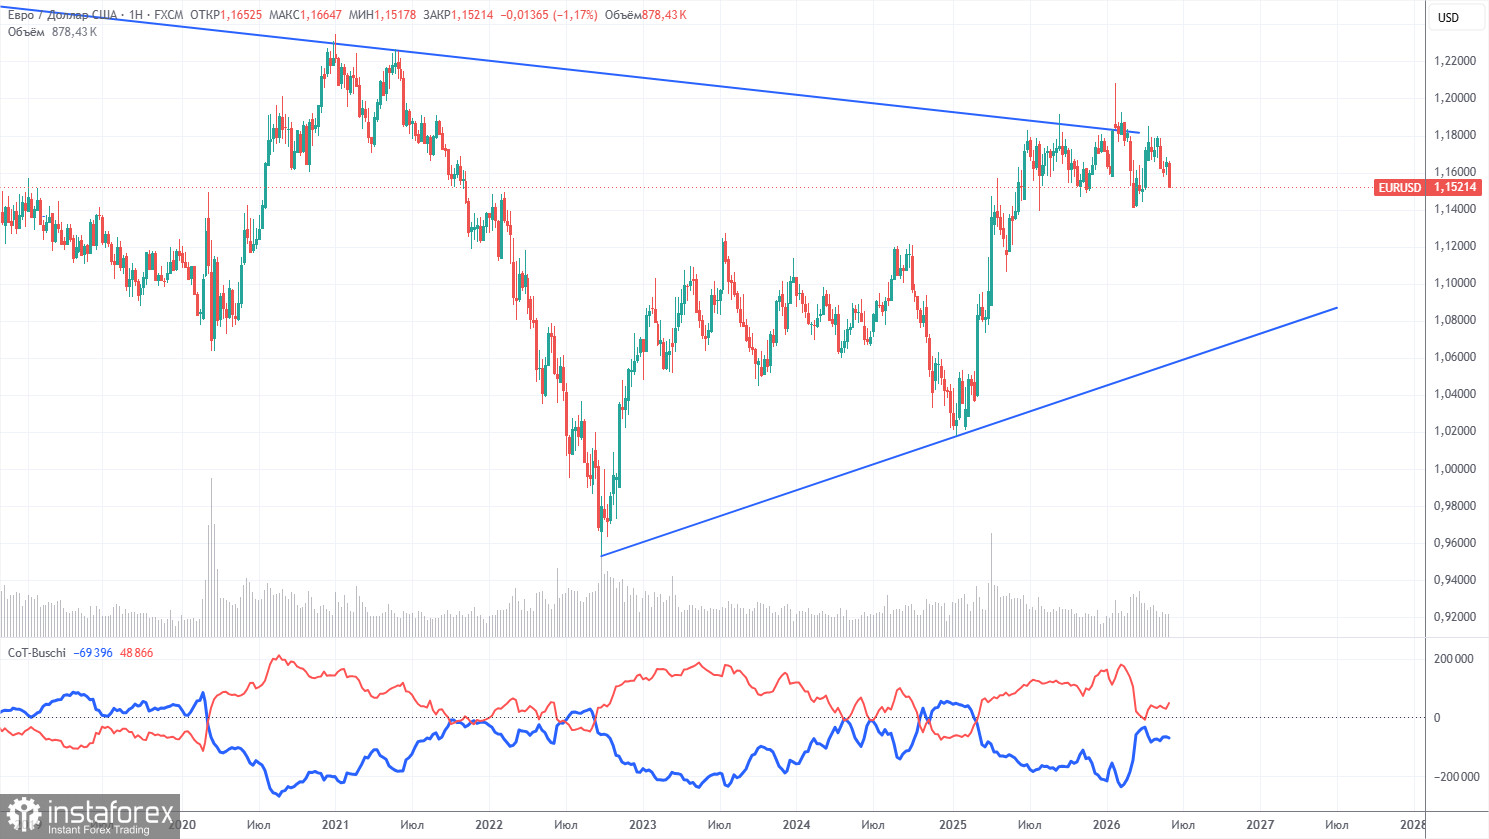
The latest COT report is dated June 2. The illustration for the weekly timeframe clearly shows that the net position of non-commercial traders remains "bullish" but has declined significantly due to geopolitical events. Traders have been offloading the European currency in favor of the US dollar in recent months. Trump's policy has not changed, but for some time, the dollar has been regarded as a "reserve currency." However, this process may already be complete.
We still do not see any fundamental factors for strengthening the euro, while there are sufficient factors for the decline of the American dollar. The war in the Middle East made the dollar temporarily super-attractive, but when this factor reaches its "expiration date," everything will return to normal. That date may have already expired. In the long term, the euro could fall to $1.08 (the trend line), but the upward trend will still remain relevant. The pair has not come particularly close to this line in recent months.
The positioning of the indicator's red and blue lines indicates parity between bulls and bears. Over the last reporting week, the number of longs in the "Non-commercial" group increased by 12,400, while the number of shorts decreased by 7,000. Consequently, the net position increased by 21,400 contracts over the week.
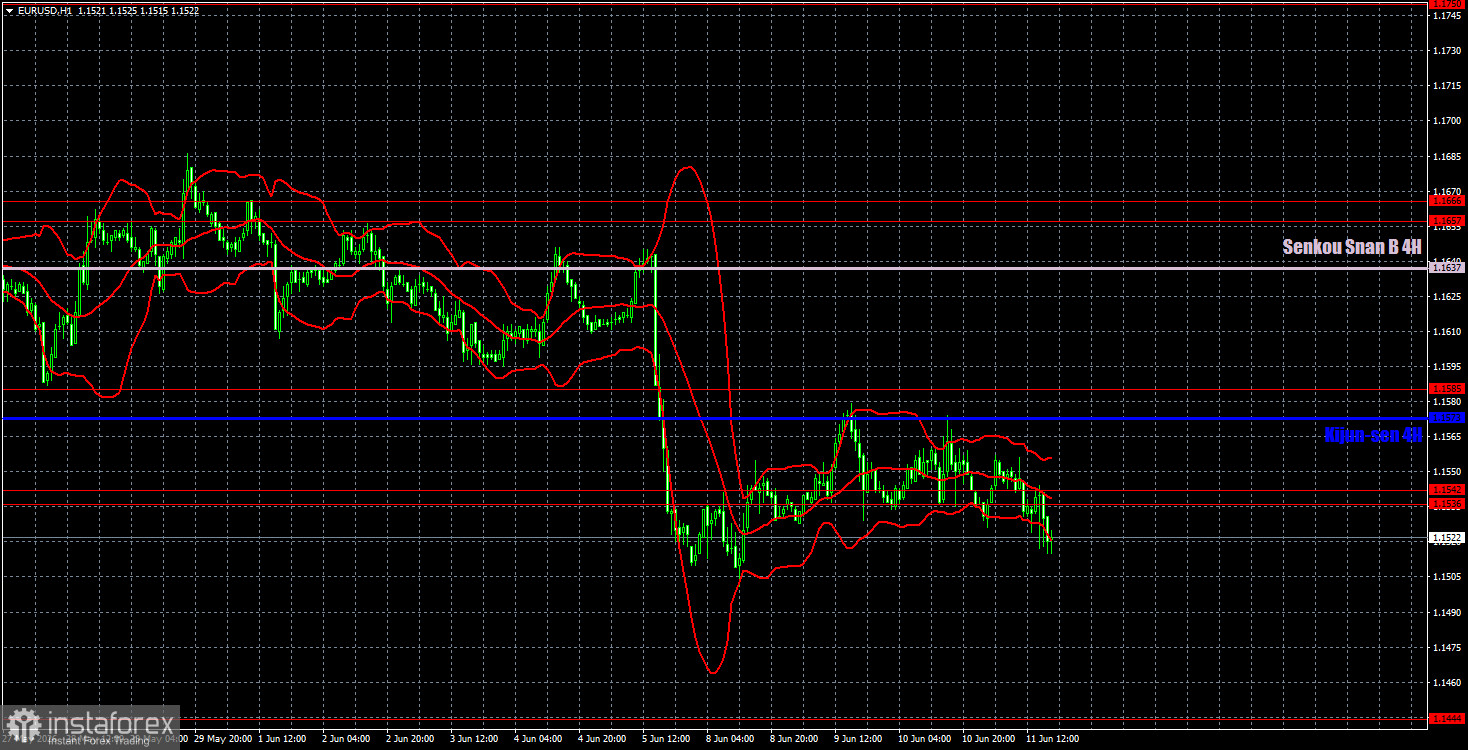
On the hourly timeframe, the EUR/USD pair has resumed its downward trend. The situation in the Middle East remains tense, but there has been no resumption of full-scale war, nor have there been any peace deals. Thus, there are currently no sufficient reasons for the dollar to rise, nor are there substantial reasons for the euro to grow. However, considering ongoing geopolitical changes, such reasons may emerge.
For June 12, we identify the following levels for trading: 1.1362, 1.1426, 1.1536-1.1542, 1.1585, 1.1657-1.1666, 1.1750-1.1760, 1.1786, 1.1830-1.1837, 1.1907-1.1922, as well as the Senkou Span B line (1.1637) and the Kijun-sen line (1.1573). The Ichimoku indicator lines may shift throughout the day, which should be considered when determining trading signals. Remember to set a stop-loss order at breakeven if the price moves in the correct direction by 15 pips. This will safeguard against potential losses if the signal proves false.
On Friday, the Eurozone will publish the second estimate of the inflation report for Germany, while the US will release the University of Michigan consumer sentiment index. We consider both reports secondary, especially now that the market is ignoring 90% of economic data.
Today, traders may remain in short positions with a target of 1.1444, as the price has consolidated below the area of 1.1536-1.1542. Long positions can be opened if there is consolidation above 1.1585, targeting 1.1637.
¡Los informes analíticos de InstaForex lo mantendrá bien informado de las tendencias del mercado! Al ser un cliente de InstaForex, se le proporciona una gran cantidad de servicios gratuitos para una operación eficiente.


