 Permanecer
Condiciones de negociación
Products
Herramientas


The EUR/USD currency pair showed absolutely no interesting "movements" on Friday. The price moved exclusively sideways with low volatility. Therefore, we can confidently say that the market ignored all the day's events. As for geopolitical events, the market has been ignoring them for about a month now and shows its readiness to react only to actual Events, rather than empty statements and promises. Since there were no actual Events on Friday, there was nothing to react to. Over the weekend, Donald Trump stated that the deal would be signed on Sunday. Unsurprisingly, no deal was signed on Sunday, and Iran reported that it might need a few more days, once again refuting Trump's promises. As for the macroeconomic reports on Friday, it is again easy to guess that they were ignored. Last week, the market did not pay close attention to the European Central Bank meeting and the US inflation report. On Monday morning, it became known that the deal between Iran and the US had been agreed upon but had not yet been signed.
From a technical perspective, the downward trend remains in place, but whether it will continue is a big question. If Tehran and Washington do manage to sign the deal this week, demand for the US currency will decrease. However, currently, the parties have only agreed on the document, and it is unknown when it will be signed. At the market opening, traders reacted with cautious dollar selling, but it is clear they still doubt peace in the Middle East.
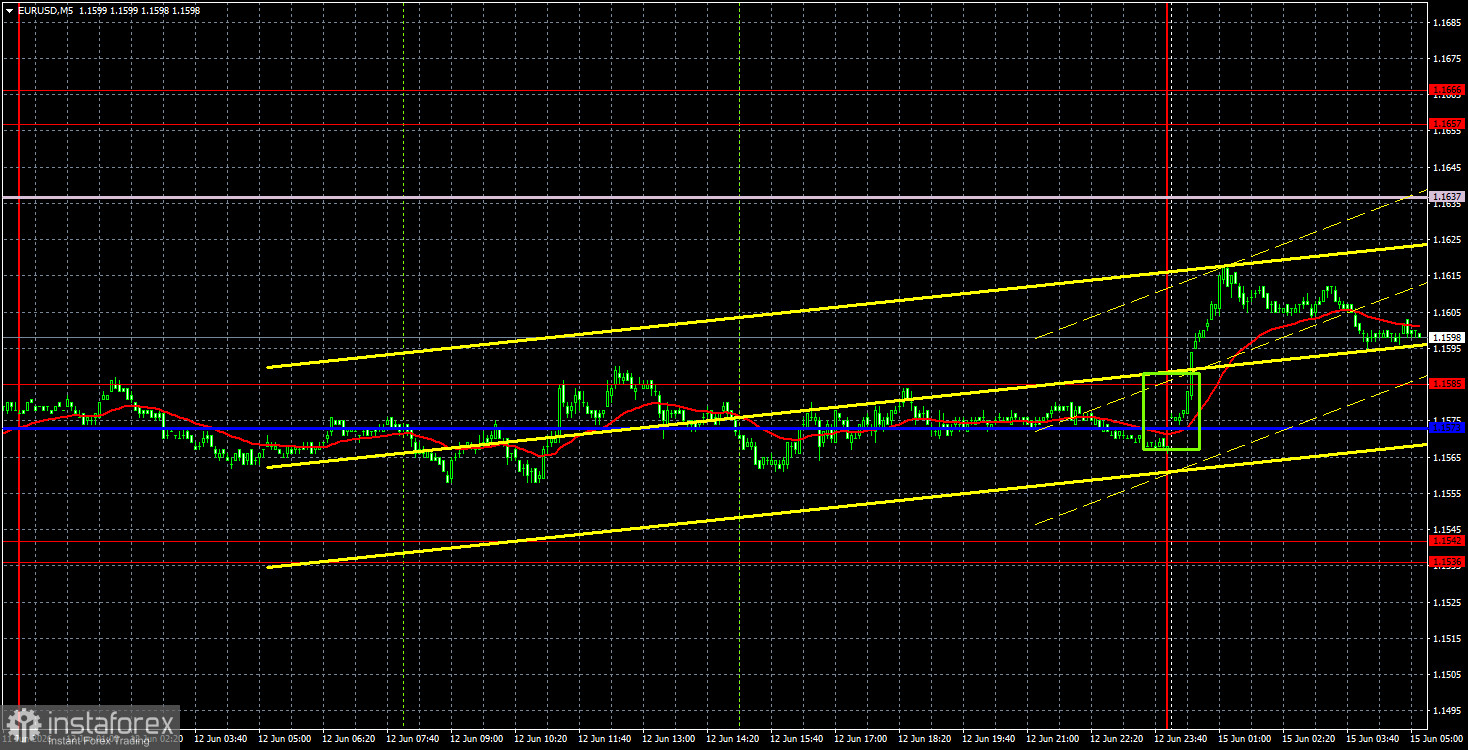
On the 5-minute timeframe, the price formed several sell signals on Friday, but we did not even consider them, as the pair exclusively moved sideways throughout the day, with volatility at zero. On Monday night, a buy signal was formed after breaking through the 1.1573-1.1585 area.
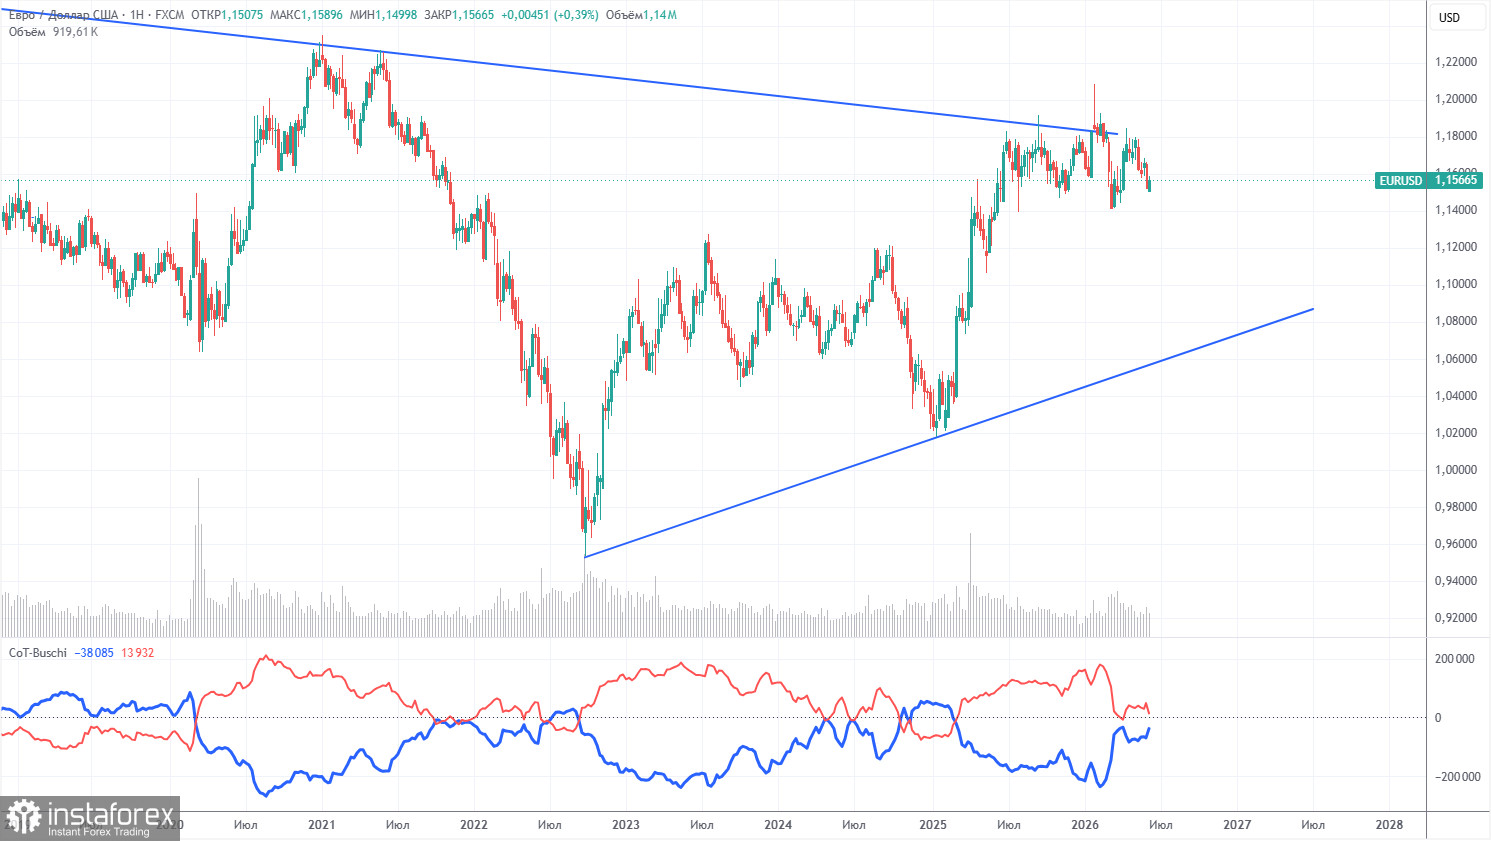
The latest COT report is dated June 9. The illustration on the weekly timeframe clearly shows that the net position of non-commercial traders remains "bullish" but has declined significantly due to geopolitical events. Traders have been getting rid of the euro in favor of the US dollar in recent months. Trump's policies have not changed, but for a time, the dollar served as a "reserve currency." However, this process may already be complete.
We still do not see any fundamental factors to strengthen the euro, while there are enough factors to weaken the US dollar. The war in the Middle East made the dollar temporarily extremely attractive, but once this factor reaches its "expiration date," everything will return to normal. And it may have already expired. In the long term, the euro could fall to as low as $1.08 (the trend line), but the upward trend will still remain relevant. Over the past few months, the pair has not moved significantly closer to this line.
The positions of the indicator's red and blue lines suggest parity between bulls and bears. During the last reporting week, the number of long positions in the "Non-commercial" group decreased by 15,900, while the number of shorts increased by 19,000. Consequently, the net position fell by 34,900 contracts over the week.
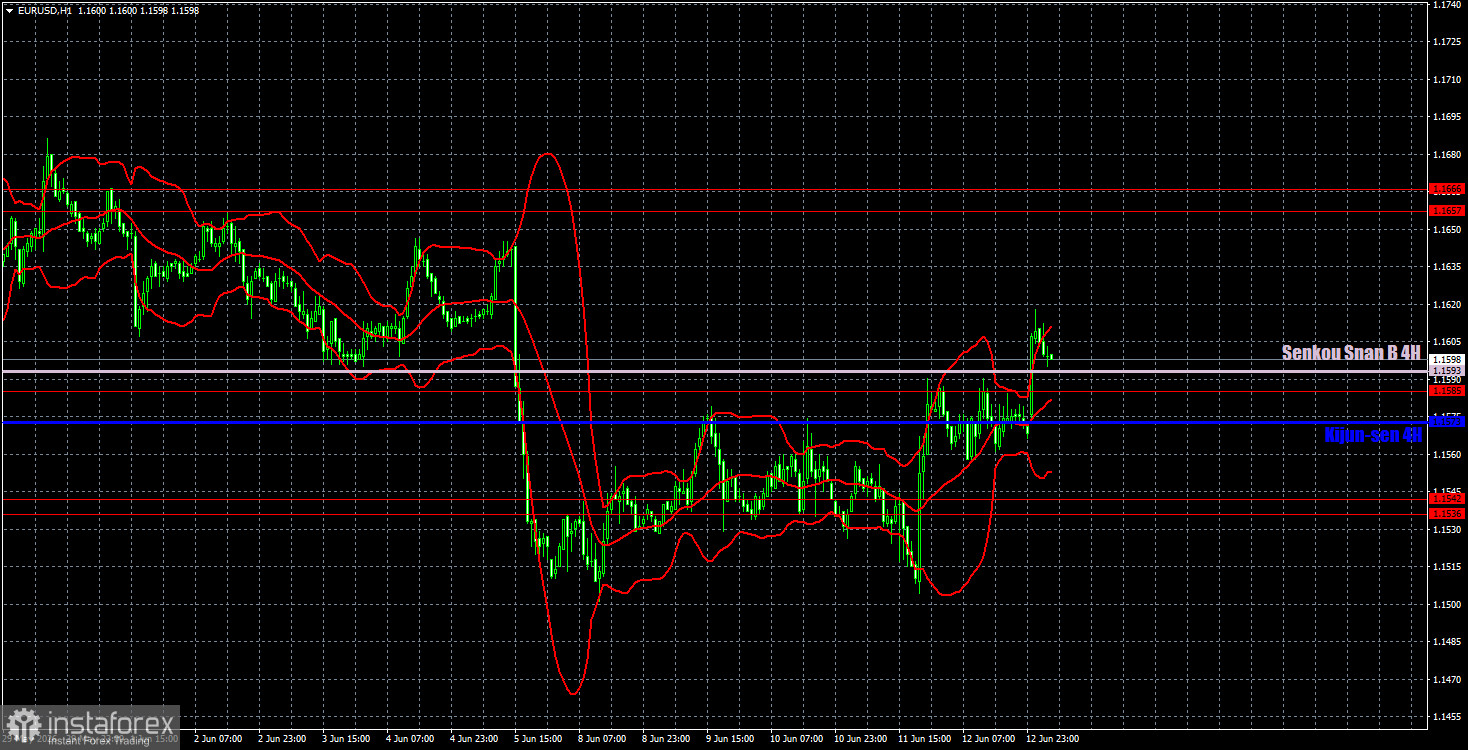
On the hourly timeframe, the EUR/USD pair could break the downward trend as it has settled above the Senkou Span B line. The situation in the Middle East remains tense, but there is no resumption of full-scale war, nor is there a peace deal. Thus, there are currently no sufficient reasons for growth in the dollar, nor are there sufficient reasons for growth in the euro. However, given the constant geopolitical changes, such reasons may arise.
For June 15, we highlight the following levels for trading: 1.1362, 1.1426, 1.1536-1.1542, 1.1585, 1.1657-1.1666, 1.1750-1.1760, 1.1786, 1.1830-1.1837, 1.1907-1.1922, as well as the Senkou Span B line (1.1593) and the Kijun-sen line (1.1573). The Ichimoku indicator lines may shift throughout the day, which should be considered when determining trading signals. Do not forget to set a Stop Loss order to break even if the price moves in the right direction by 15 pips. This will safeguard against potential losses if the signal proves false.
On Monday, reports on industrial production will be published in the European Union and the United States, which are unlikely to attract traders' attention. The market continues to ignore 98% of macroeconomic events, awaiting a geopolitical resolution.
Today, traders can open short positions with targets in the 1.1536-1.1542 range if the price settles below the 1.1585-1.1593 range. Long positions can be opened on a bounce off the Senkou Span B line, with a target of 1.1657-1.1666.
Support and resistance price levels – thick red lines, around which the movement may end. They are not sources of trading signals.
Kijun-sen and Senkou Span B lines – Ichimoku indicator lines, transferred to the hourly timeframe from the 4-hour timeframe. They are strong lines.
Extreme levels – thin red lines from which the price previously rebounded. They are sources of trading signals.
Yellow lines – trend lines, trend channels, and other technical patterns.
Indicator 1 on COT charts – the size of the net position of each category of traders.
¡Los informes analíticos de InstaForex lo mantendrá bien informado de las tendencias del mercado! Al ser un cliente de InstaForex, se le proporciona una gran cantidad de servicios gratuitos para una operación eficiente.


