 Permanecer
Condiciones de negociación
Products
Herramientas


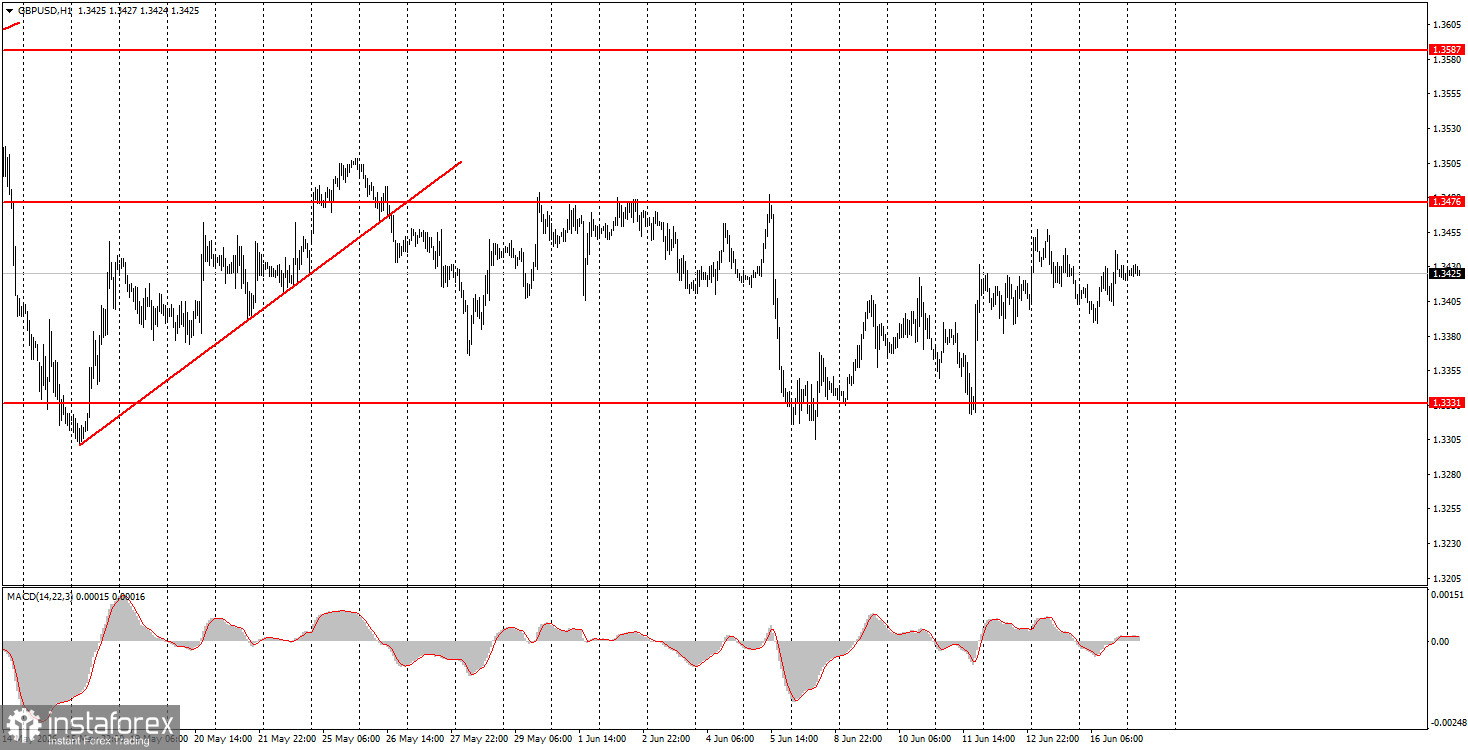
The GBP/USD pair did not show any interesting movements on Tuesday. There were no significant macroeconomic reports scheduled for the day, and there is currently a lull in geopolitical matters, as Tehran and Washington have agreed on the terms of a provisional agreement, with the world now waiting for the deal's signing and the opening of the Strait of Hormuz. However, optimism is not at its highest level. The market has learned that the opening of the Strait of Hormuz will not immediately restore traffic to pre-war volumes, and many unresolved issues remain between Iran and the U.S., which could lead to further escalations. Therefore, no one is in a hurry to sell the dollar, and the GBP/USD pair has been trading in a sideways channel for over a month, as clearly shown in the illustration above. Today, the UK will release an inflation report that will influence the Bank of England's future monetary policy decisions. In the evening, there is a Federal Reserve meeting, which is important and interesting in itself.
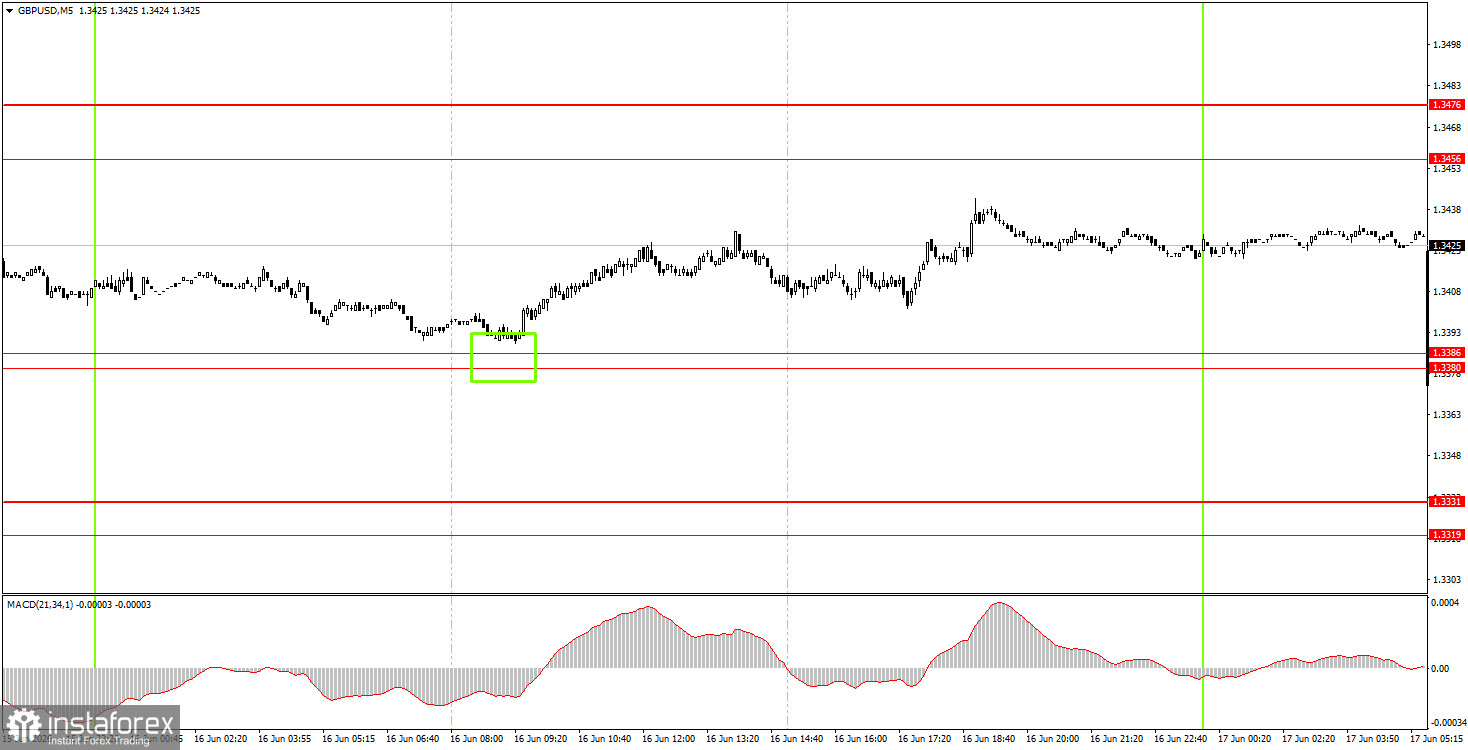
On the 5-minute timeframe, one buy trading signal was generated on Tuesday with a small margin of error (3 pips). At the start of the European trading session, the pair bounced from the 1.3380-1.3386 area and rose 25-30 pips by the end of the day. Novice traders could relatively easily earn these 25-30 pips, as the movement throughout the day was almost one-sided.
On the hourly timeframe, the GBP/USD pair has been trading in a flat range for the second month in a row, as geopolitical tensions remain high and the outlook is not particularly optimistic. Without a resumption of full-scale war in the Middle East, the dollar cannot expect the growth it saw in February-March. However, the market is not in a hurry to draw conclusions, as it remains uncertain about many issues related to the future ceasefire and to safe, full traffic through the Strait of Hormuz.
On Wednesday, novice traders may open short positions with a target of 1.3380-1.3386 in the event of a price bounce from the 1.3456-1.3476 area. A price consolidation above the 1.3456-1.3476 area will allow opening long positions with a target of 1.3587-1.3598.
On the 5-minute timeframe, trading can currently focus on levels 1.3175-1.3180, 1.3259-1.3267, 1.3319-1.3331, 1.3380-1.3386, 1.3456-1.3476, 1.3587-1.3598, 1.3631-1.3641, 1.3695, and 1.3741-1.3751. On Wednesday, the UK is scheduled to publish its May inflation report, and in the U.S., the Fed will announce the results of its meeting. We do not expect a change in the key interest rate, but statements made by the new Fed chair, Kevin Warsh, could influence market sentiment.
Price levels (areas) of support and resistance are targets when opening long or short positions or sources of signals.
Red lines indicate channels or trend lines that display the current trend and indicate the preferred direction for trading.
The MACD indicator (14,22,3) – histogram and signal line – is a supplementary indicator that can also be used as a source of signals.
Important speeches and reports (contained in the news calendar) can significantly impact the movement of the currency pair. Therefore, during their release, trading should be conducted with maximum caution, or one should exit the market to avoid sharp reversals against preceding movements.
Beginners trading in the forex market should remember that not every trade can be profitable. Developing a clear strategy and practicing money management are key to long-term success in trading.
¡Los informes analíticos de InstaForex lo mantendrá bien informado de las tendencias del mercado! Al ser un cliente de InstaForex, se le proporciona una gran cantidad de servicios gratuitos para una operación eficiente.


