 Permanecer
Condiciones de negociación
Products
Herramientas


The EUR/USD currency pair continued its downward movement during Tuesday's trading, following the Federal Reserve meeting last Wednesday. The pair cannot even undergo a minor correction, indicating a total sell-off of the European currency. Formally, there were reasons for traders to sell the euro yesterday. In the morning, business activity indices for the services and manufacturing sectors were published in Germany and the European Union, with almost all values weaker than forecasts and the previous month. However, the market has been ignoring most macroeconomic data for the past three months, and the dollar has been steadily rising for an entire week, regardless of the presence or absence of reasons. Many experts believe the dollar is rising due to a strengthening "hawkish" stance from the Fed. We believe this is not the case. The American currency is rising without reason, solely based on the technical factor of an existing downward trend. It is worth remembering that the European Central Bank raised its key interest rate two weeks ago, unlike the Fed, and this went without any market reaction.
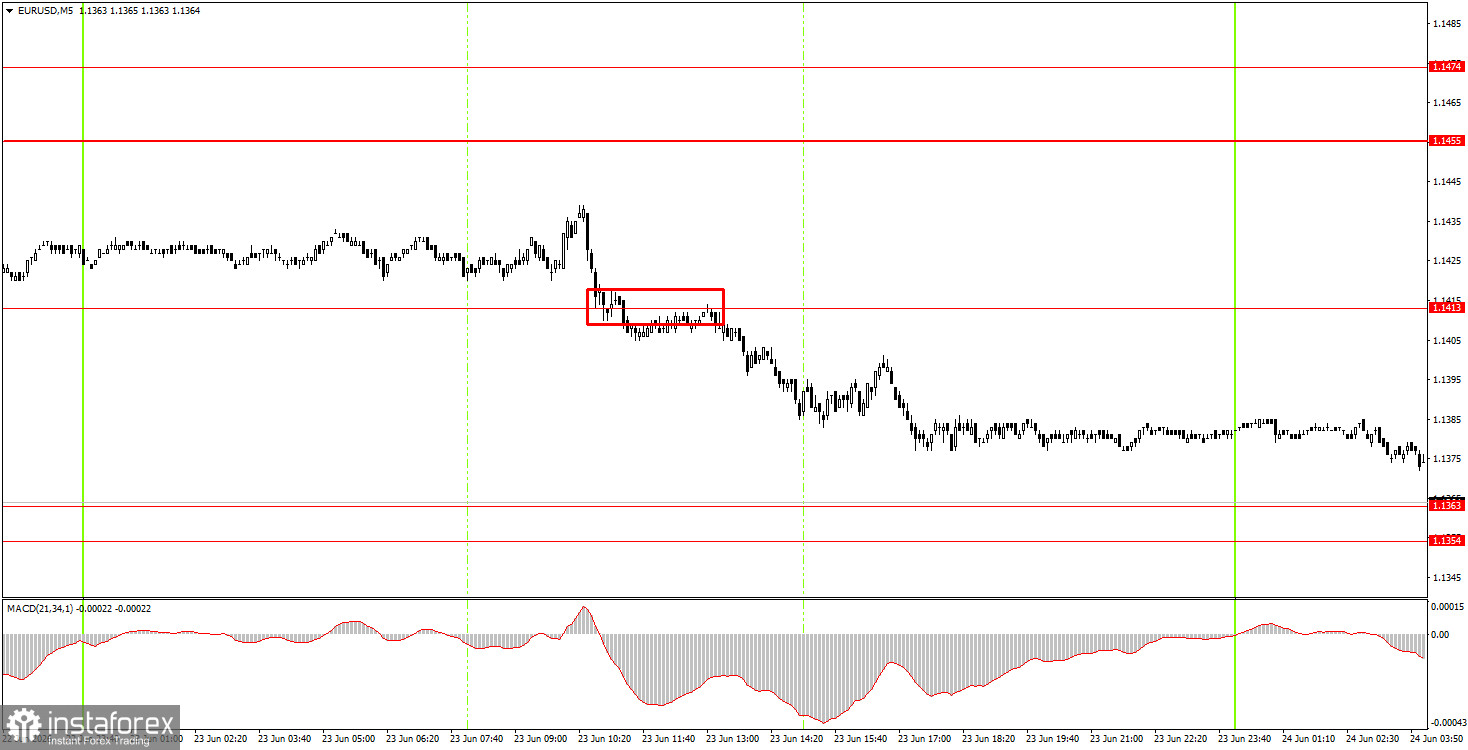
In the 5-minute timeframe on Tuesday, one sell trading signal was generated. During the European trading session, the price consolidated below 1.1413, allowing novice traders to open short positions. By the end of the day, the price had dropped by about 20 pips, and overnight it reached the 1.1354-1.1363 area.
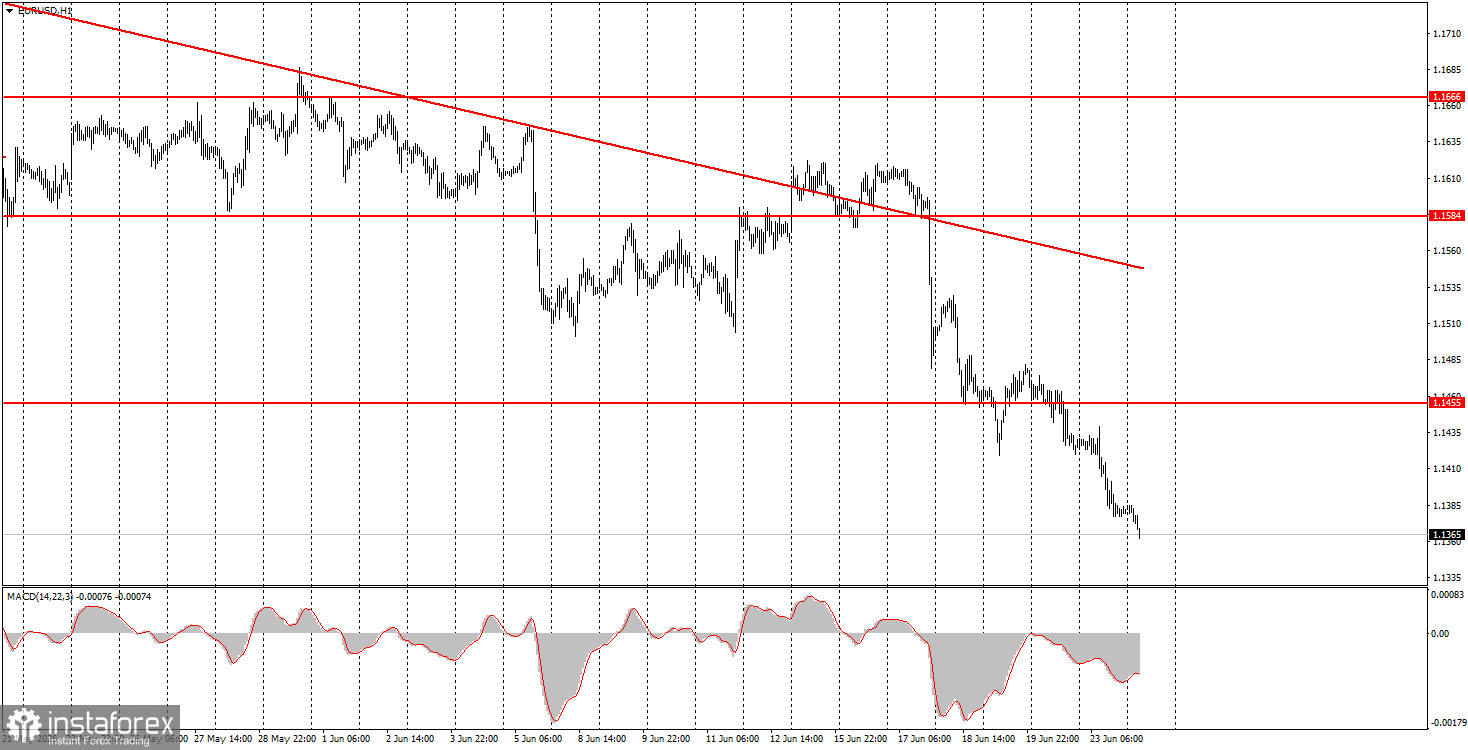
On the hourly timeframe, the downward trend has resumed. Since the deal between Iran and the U.S. was signed, the market has one less reason to buy the U.S. dollar. However, the market pays no attention to this factor and generally ignores almost all factors in favor of the euro. Thus, the current strengthening of the U.S. dollar has no specific cause.
On Wednesday, novice traders can open short positions with a target of 1.1292 if the price stabilizes below the 1.1354-1.1363 area. Long positions can be opened with a target of 1.1413 if the price bounces off the 1.1354-1.1363 area.
On the 5-minute timeframe, the levels to consider are 1.1292, 1.1354-1.1363, 1.1413, 1.1455-1.1474, 1.1527-1.1531, 1.1584-1.1594, 1.1655-1.1666, 1.1745-1.1754, and 1.1830-1.1837. On Wednesday, Germany will publish its business climate index, and the U.S. will release a report on new home sales. Both reports are secondary and are not significant for the market, which has been buying the dollar for a week.
Price levels (areas) of support and resistance are targets when opening long or short positions or sources of signals.
Red lines indicate channels or trend lines that display the current trend and indicate the preferred direction for trading.
The MACD indicator (14,22,3) – histogram and signal line – is a supplementary indicator that can also be used as a source of signals.
Important speeches and reports (contained in the news calendar) can significantly impact the movement of the currency pair. Therefore, during their release, trading should be conducted with maximum caution, or one should exit the market to avoid sharp reversals against preceding movements.
Beginners trading in the forex market should remember that not every trade can be profitable. Developing a clear strategy and practicing money management are key to long-term success in trading.
¡Los informes analíticos de InstaForex lo mantendrá bien informado de las tendencias del mercado! Al ser un cliente de InstaForex, se le proporciona una gran cantidad de servicios gratuitos para una operación eficiente.


