 Permanecer
Condiciones de negociación
Products
Herramientas



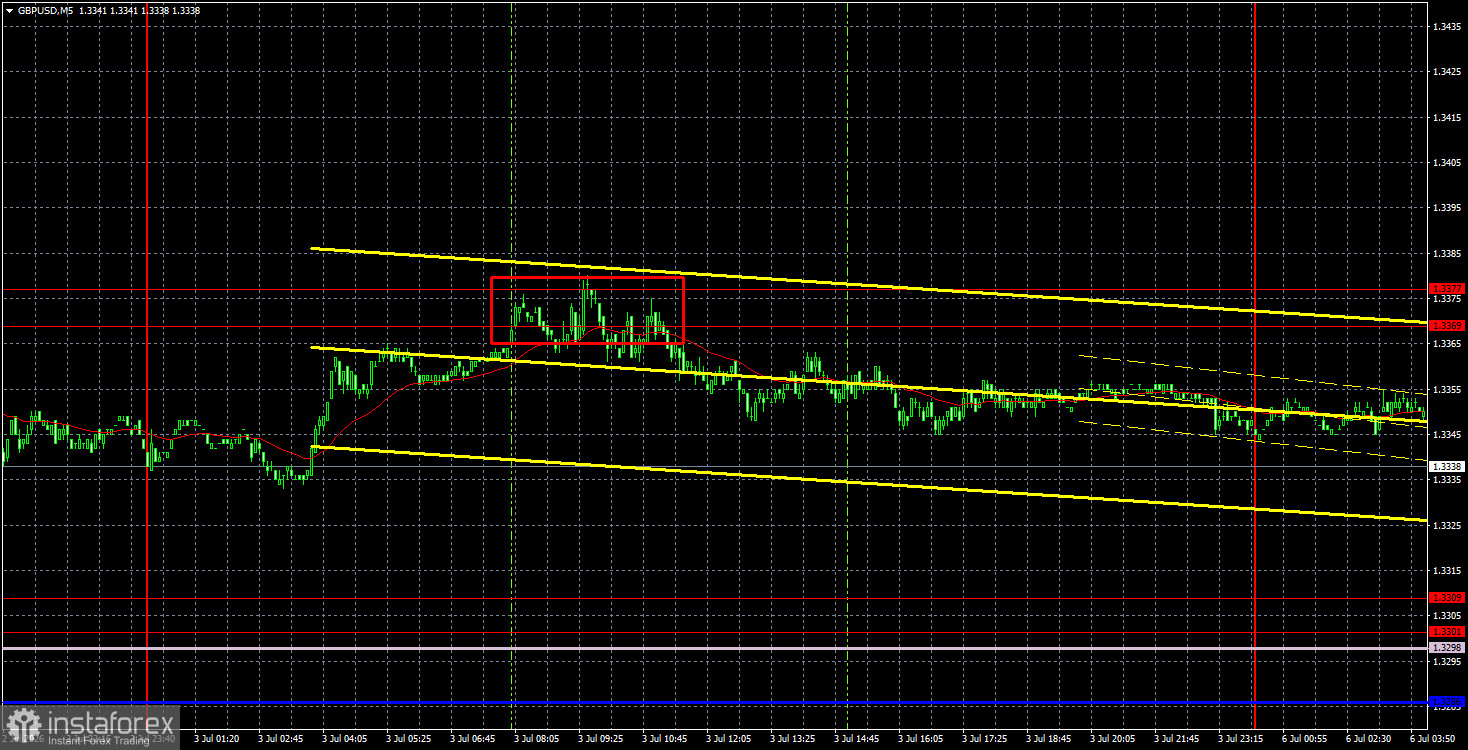
The GBP/USD currency pair attempted to continue its upward move on Friday but, for the second time, failed to break through the resistance area of 1.3369-1.3377, bouncing off and initiating a correction. The upward trend remains intact, and the British currency has significantly strengthened its position over the past two weeks. In our view, the growth of the pound sterling is entirely justified, as the U.S. dollar has recently been in demand for no clear reason. Thus, we welcome further growth of the pair. On Friday, there were no important events in the UK, apart from a speech by Andrew Bailey. However, judging by the market's reaction, the Bank of England's head did not convey anything significant. Overall, the BoE made it clear that it does not intend to raise the key rate anytime soon, expecting a slight rise in inflation until the end of the year, but anticipating the consumer price index will drop to the target level next year without tightening monetary policy.
From a technical standpoint, the British pound remains within an upward trend, as indicated by the trend line. Although the area of 1.3369-1.3377 could not be breached, this does not mean that the "northern" impulse has faded. The price may correct toward the 1.3301-1.3309 area and then resume its rise. This week, there will be very few important events, so traders may trade based on technical analysis. We believe that the upward movement should continue at least within the sideways channel on the daily timeframe.
On the 5-minute timeframe, one sell signal was generated on Friday. During the European trading session, the price bounced off the 1.3369-1.3377 area and then dropped about 10-15 pips by the end of the day. Volatility was weak due to the Independence Day holiday in the U.S.
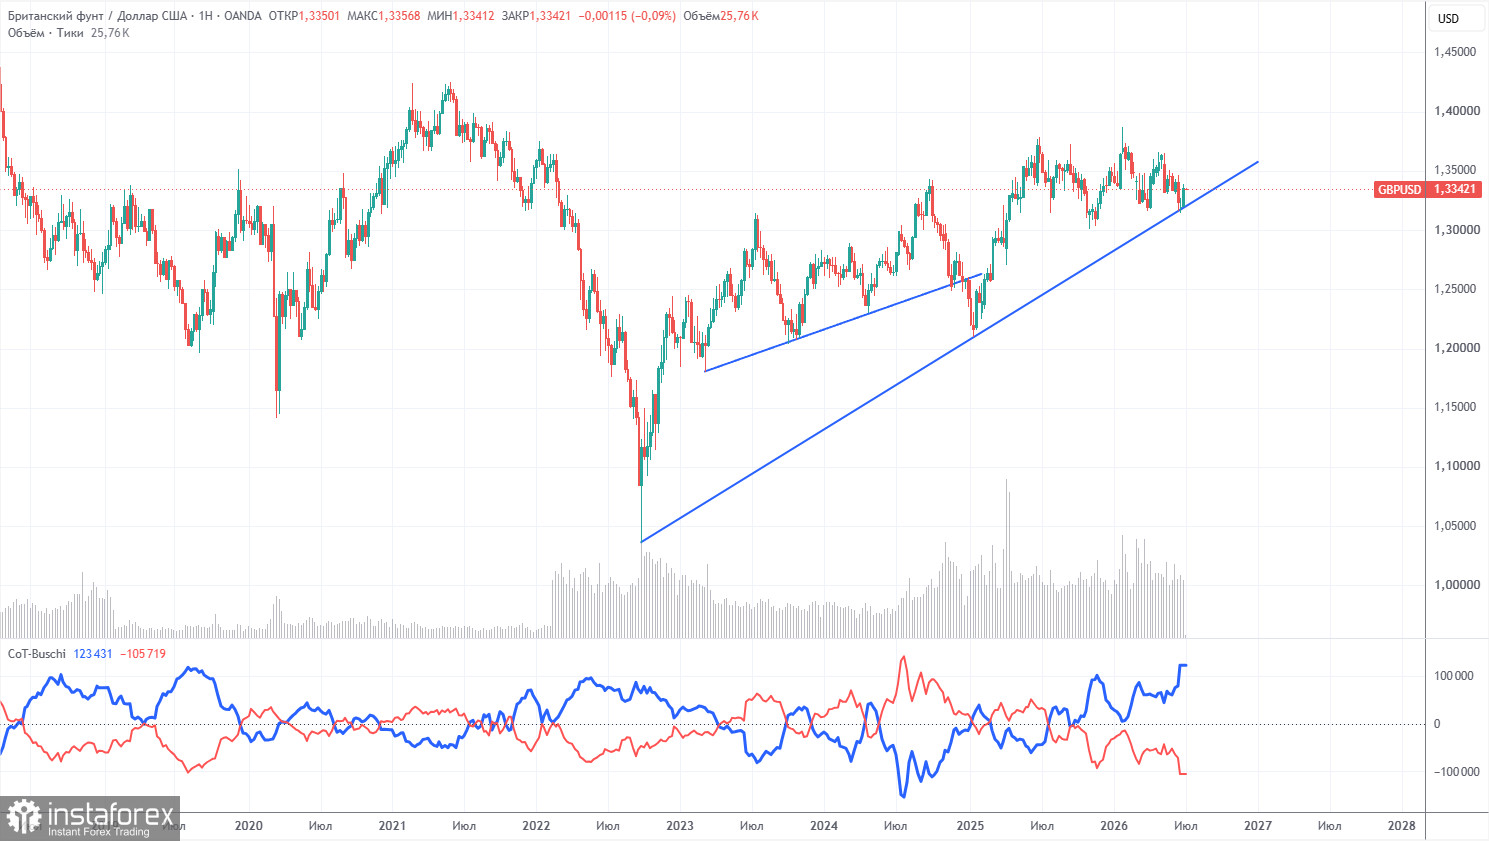
COT reports on the British pound indicate that commercial traders' sentiment has been constantly changing over the past few years. The red and blue lines showing the net positions of commercial and non-commercial traders frequently cross each other and are often close to the zero mark. Currently, the lines are moving apart, with non-commercial traders dominating with their... short positions. Given the events in the Middle East, it is not surprising that demand for riskier currencies is low.
In the long term, the dollar continues to decline due to Donald Trump's policies, which is clearly visible on the weekly timeframe (illustration above). The trade war will continue in one form or another for a long time, and Trump's policies are aimed both directly and indirectly at weakening the American currency. However, geopolitical factors remain paramount at this time, providing strong support for the dollar in 2026. Since the conflict in the Middle East is not yet resolved, the U.S. dollar may continue to appreciate. According to the last COT report (dated June 23), the "Non-commercial" group closed 1,300 BUY contracts and opened 32,900 SELL contracts. Thus, the net position of non-commercial traders fell further by 31,600 contracts over the week.
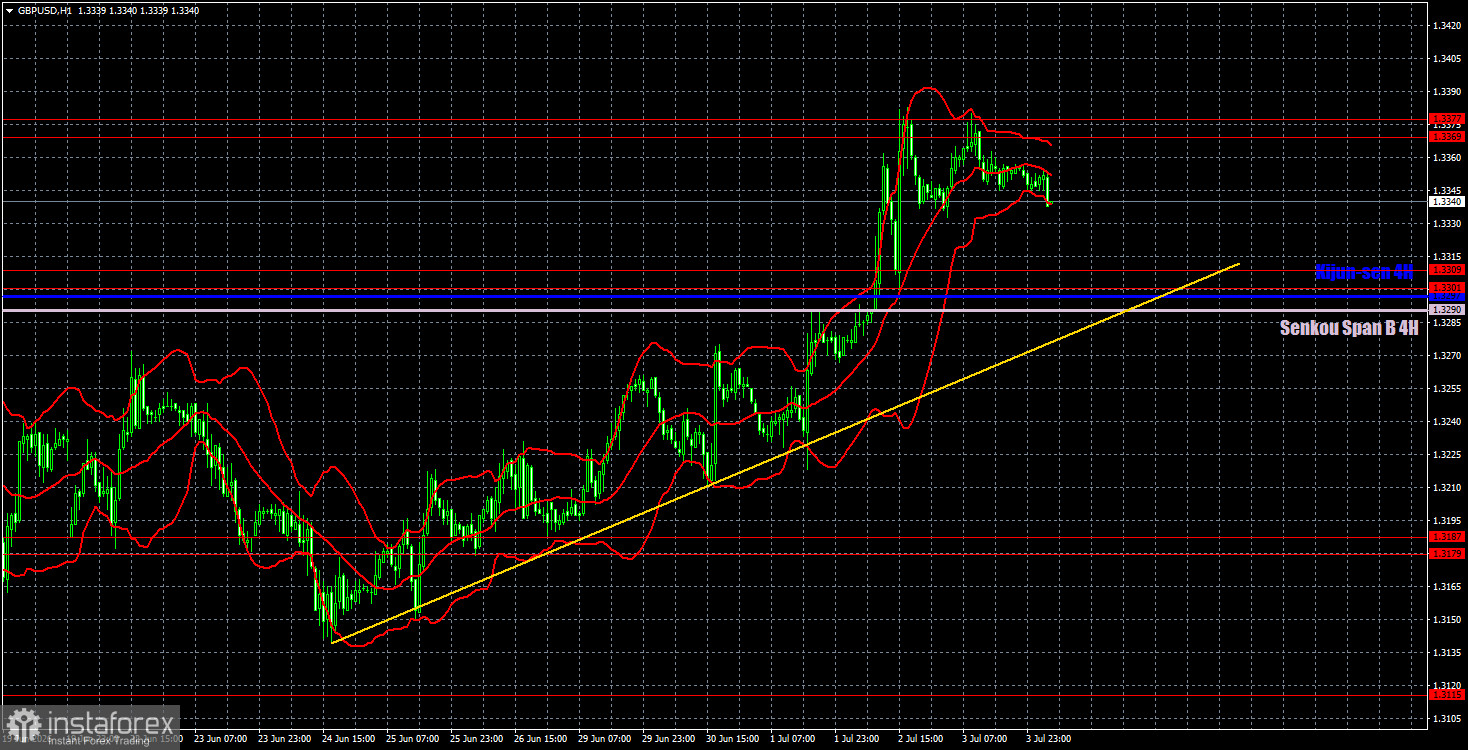
On the hourly timeframe, the GBP/USD pair continues to form an upward trend. In the long term, the British pound still has few reasons to fall, while the U.S. dollar has few reasons to rise. Recently, the market has largely ignored fundamental, geopolitical, and macroeconomic events, and on the daily timeframe, the pair is at the lower end of the sideways range. Therefore, we continue to expect growth.
For July 6, we highlight the following important levels: 1.3042-1.3050, 1.3096-1.3115, 1.3179-1.3187, 1.3301-1.3309, 1.3369-1.3377, 1.3465-1.3480, 1.3588, 1.3671-1.3681. The Senkou Span B line (1.3290) and Kijun-sen (1.3297) can also serve as sources of signals. It is recommended to set a Stop Loss at breakeven once the price has moved in the right direction by 20 pips. The Ichimoku indicator lines may shift throughout the day, which should be taken into account when determining trading signals.
On Monday, there are no important events or publications scheduled in the UK, while the ISM Services PMI will be released in the U.S., the day's most important event. However, overall, the market may move sluggishly this week due to the lack of significant events.
Today, traders can remain in short positions targeting the area of 1.3290-1.3309, as the pair has bounced off the area of 1.3369-1.3377 twice. Long positions can be opened on a consolidation above the 1.3369-1.3377 area or on a bounce from the 1.3290-1.3309 area.
¡Los informes analíticos de InstaForex lo mantendrá bien informado de las tendencias del mercado! Al ser un cliente de InstaForex, se le proporciona una gran cantidad de servicios gratuitos para una operación eficiente.


