 Permanecer
Condiciones de negociación
Products
Herramientas



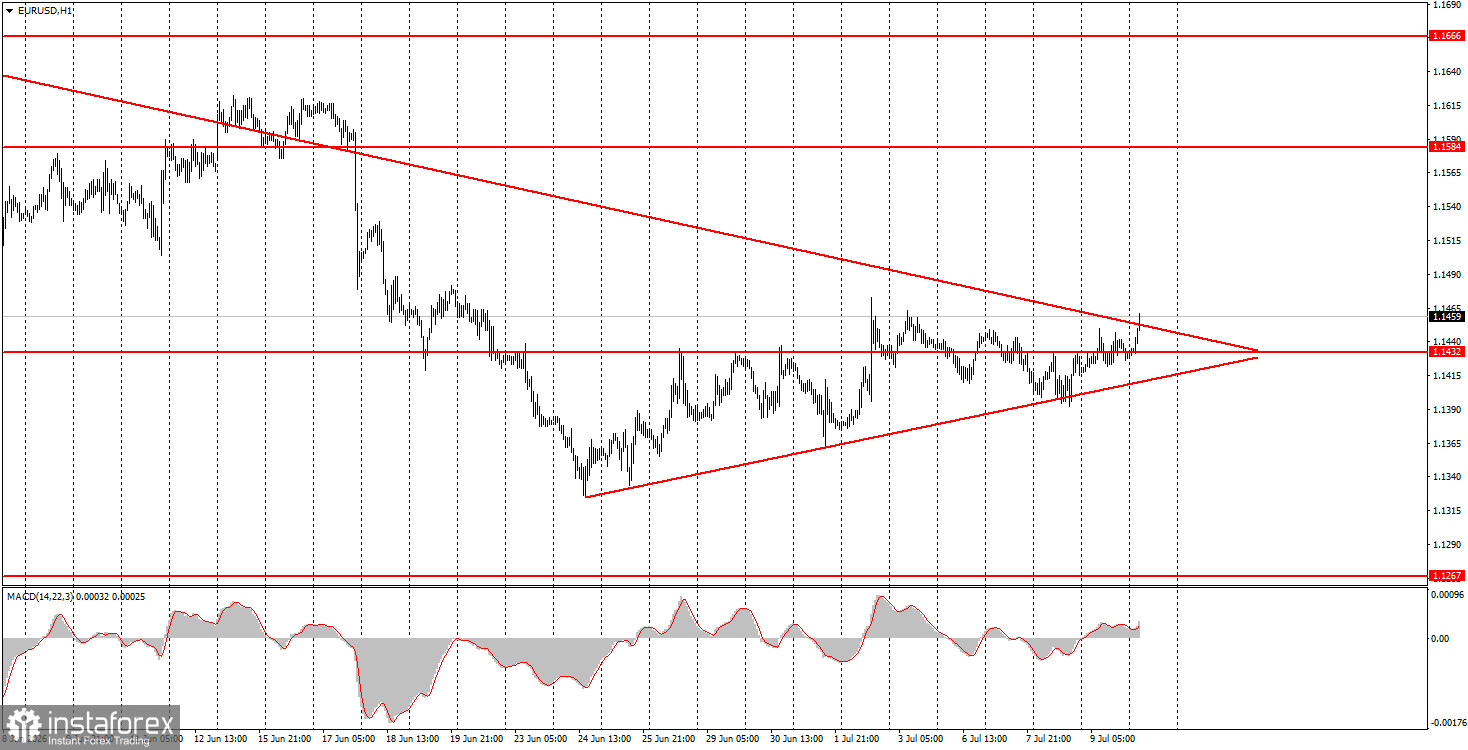
The EUR/USD currency pair showed no interesting movements during trading on Thursday, and there were no significant macroeconomic reports or fundamental or geopolitical events throughout the day. Thus, traders had nothing to react to during the day, which explains the pair's weak movements not only on Thursday but also over the past week. It is worth noting that last Friday was essentially a day off due to Independence Day in the US. From last Friday to today, the pair's daily volatility has not exceeded 40 pips, a minimal value. The only significant events over the past five days have been the ISM Services PMI in the US and the escalation in the Middle East. The ISM index value matched forecasts, while the market has ignored geopolitics for over a month. Thus, there were no reasons for strong movements in the European currency this week. Technically, the upward correction continues.
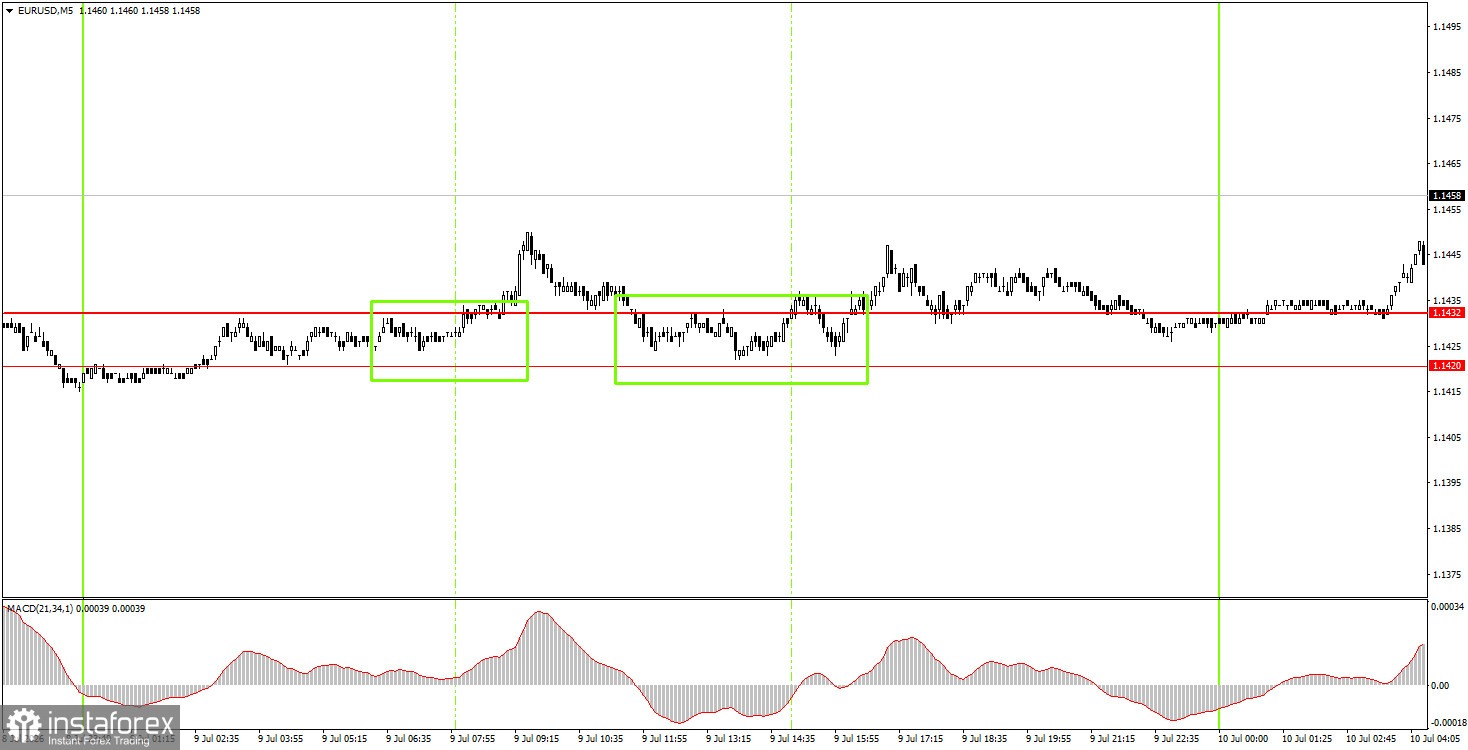
On the 5-minute timeframe, two trading signals were formed on Thursday. The price bounced twice from the 1.1420-1.1432 area, but due to low volatility, it failed to show significant growth. Overnight, the price bounced from the specified area for the third time, again allowing novice traders to open long positions with the target of 1.1527-1.1531.
On the hourly timeframe, a two-month downward trend persists, and over the past few weeks, we have seen only a weak upward correction. Currently, the descending trend line has been broken, but this has not yet changed anything. It has been broken before, and the euro's growth is extremely weak. Therefore, we tend to believe the downward trend continues, but there is also an upward correction against it.
On Friday, novice traders can open short positions targeting 1.1354-1.1363 if the price consolidates below the 1.1420-1.1432 area. Long positions can be maintained with a target of 1.1527-1.1531, as the price has bounced three times from the 1.1420-1.1432 area.
On the 5-minute timeframe, levels to be considered are 1.1292, 1.1354-1.1363, 1.1420-1.1432, 1.1527-1.1531, 1.1584-1.1594, 1.1655-1.1666, 1.1745-1.1754, 1.1830-1.1837. On Friday, no significant events or publications are scheduled in the Eurozone or the US. Overnight, the pair showed decent movement, but during the day, we may again expect low volatility.
Price levels (areas) of support and resistance are targets when opening long or short positions or sources of signals.
Red lines indicate channels or trend lines that display the current trend and indicate the preferred direction for trading.
The MACD indicator (14,22,3) – histogram and signal line – is a supplementary indicator that can also be used as a source of signals.
Important speeches and reports (contained in the news calendar) can significantly impact the movement of the currency pair. Therefore, during their release, trading should be conducted with maximum caution, or one should exit the market to avoid sharp reversals against preceding movements.
Beginners trading in the forex market should remember that not every trade can be profitable. Developing a clear strategy and practicing money management are key to long-term success in trading.
¡Los informes analíticos de InstaForex lo mantendrá bien informado de las tendencias del mercado! Al ser un cliente de InstaForex, se le proporciona una gran cantidad de servicios gratuitos para una operación eficiente.


