 Permanecer

Condiciones de negociación
Products
Herramientas


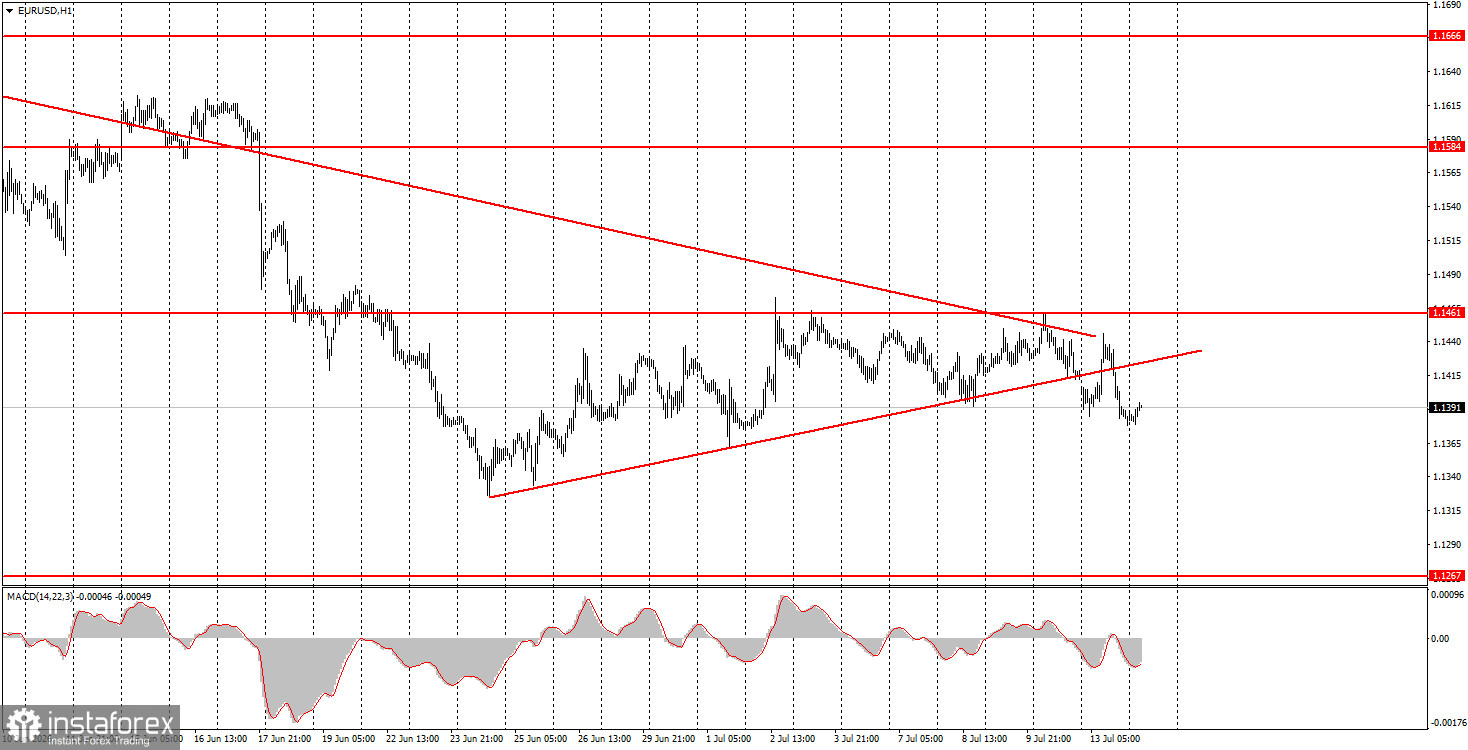
The EUR/USD currency pair showed absolutely no interesting movements in Monday's trading. In the first half of the day, the euro gained about 50 pips, while in the second half, the dollar gained about 50 pips. Essentially, the pair ended the day where it started. There were no significant fundamental or macroeconomic events to note, as there were no important occurrences in Europe or the U.S. on Monday. The only aspect worth mentioning is geopolitics, as the conflict in the Middle East has once again derailed the path toward long-term peace. However, it cannot be said that the dollar significantly strengthened its position due to this. Currently, the EUR/USD pair is simply stagnant. It has been in this state for about two weeks. The price has settled below the ascending trend line, but the descending trend remains relevant. As such, a new drop is much more likely than an increase. However, the price continues to move sideways at this time. Today, there will be at least two interesting events, so we can expect the volatility increase needed right now.
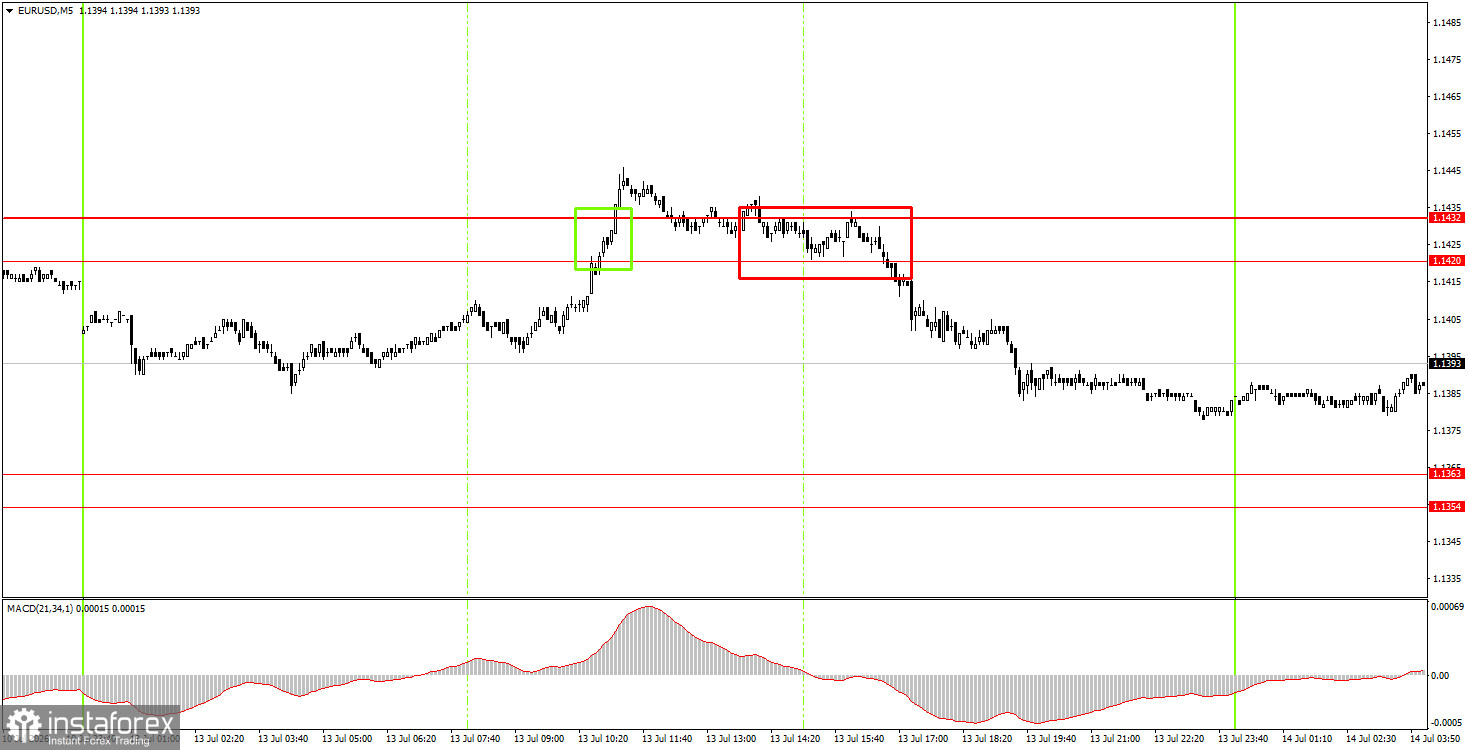
On the 5-minute timeframe, two trading signals were generated on Monday. The first signal was to buy and turned out to be false, while the second signal was to sell and allowed for recouping the loss from the first trade. Both signals formed in the area of 1.1420-1.1432 and were later adjusted to the range of 1.1461-1.1466 by the end of the day.
On the hourly timeframe, the two-month downward trend continues, and over the past few weeks, we have only seen a weak upward correction. At this time, the ascending trend line has been breached, so the likelihood of the euro resuming its decline is high, and geopolitics may provide background support for the U.S. dollar.
On Tuesday, novice traders may open short positions targeting 1.1292 if the price consolidates below the 1.1354-1.1363 area. Buy trades can be initiated with a target of 1.1461-1.1466 if the price rebounds from the 1.1354-1.1363 area.
On the 5-minute timeframe, consider the levels 1.1267-1.1275, 1.1354-1.1363, 1.1420-1.1432, 1.1527-1.1531, 1.1584-1.1594, 1.1655-1.1666, and 1.1745-1.1754. On Tuesday, there are again no significant events scheduled in the Eurozone, but an important inflation report for June will be published in the U.S., along with the first of two speeches by Federal Reserve Chair Kevin Warsh in Congress. Thus, volatility may increase today compared to the past week.
Price levels (areas) of support and resistance are targets when opening long or short positions or sources of signals.
Red lines indicate channels or trend lines that display the current trend and indicate the preferred direction for trading.
The MACD indicator (14,22,3) – histogram and signal line – is a supplementary indicator that can also be used as a source of signals.
Important speeches and reports (contained in the news calendar) can significantly impact the movement of the currency pair. Therefore, during their release, trading should be conducted with maximum caution, or one should exit the market to avoid sharp reversals against preceding movements.
Beginners trading in the forex market should remember that not every trade can be profitable. Developing a clear strategy and practicing money management are key to long-term success in trading.
¡Los informes analíticos de InstaForex lo mantendrá bien informado de las tendencias del mercado! Al ser un cliente de InstaForex, se le proporciona una gran cantidad de servicios gratuitos para una operación eficiente.


