 Permanecer

Condiciones de negociación
Products
Herramientas


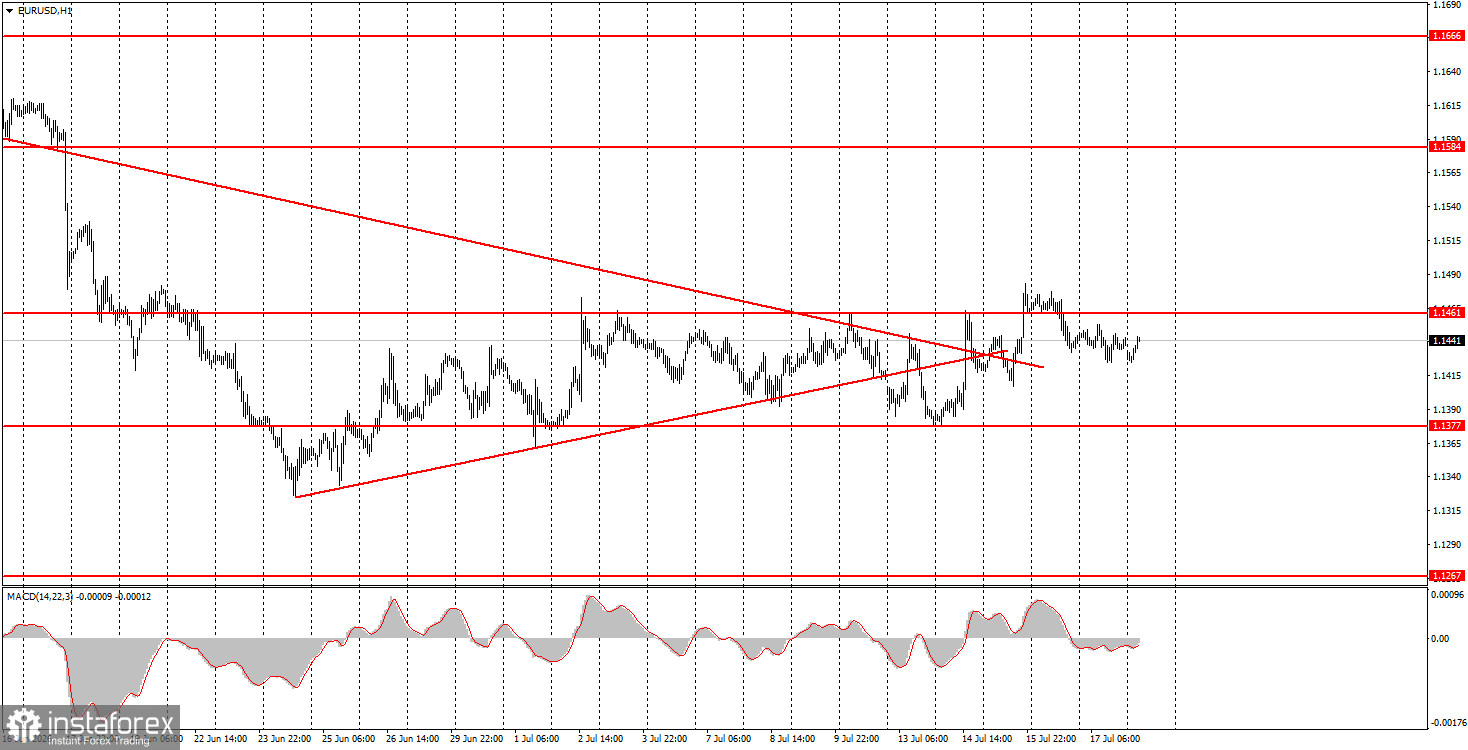
The EUR/USD currency pair continued to trade in a sideways channel during Friday's session, as clearly seen on the hourly timeframe. Formally, the EUR/USD pair has an upward slope; however, in three weeks of upward trend, the growth of the European currency has been minimal. Both trend lines have been broken and are no longer relevant. Macroeconomic data from the Eurozone and the U.S. had no impact on traders' sentiments on Friday, and the overall volatility for the day did not exceed 30 pips. Thus, the market continues to remain stagnant. Overall, the current upward movement appears to be a correction ahead of a new strong decline. However, one must ask, what could justify the expectation of a new strengthening of the U.S. dollar? Only geopolitics and the Federal Reserve's monetary policy come to mind. The market could also buy the dollar even without reasons. Currently, there are no technical signs indicating a potential rise for the European currency.
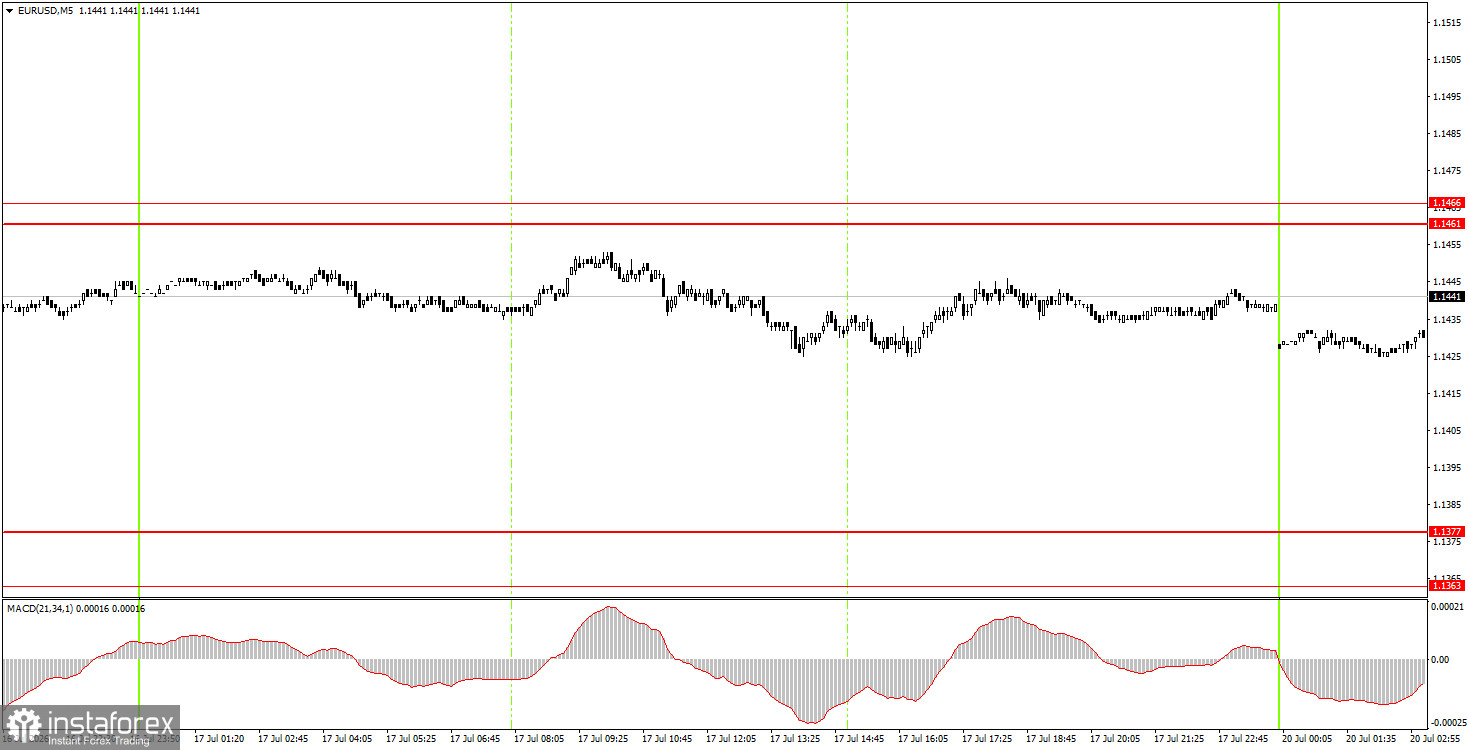
On the 5-minute timeframe, no trading signals were formed on Friday. The price failed to test any level or area throughout the day. Thus, there were no grounds for novice traders to open any positions.
On the hourly timeframe, both trend lines have been broken and are no longer relevant. Considering all the market events and movements over the last few months, we believe the European currency should show confident growth—much stronger than it is now. However, in reality, the current upward movement is primarily a correction, and in recent weeks, the movement resembles a flat much more than a trend.
On Monday, novice traders may open short positions targeting 1.1363-1.1377 if the price bounces off the 1.1461-1.1466 area. Long positions can be opened with a target of 1.1527-1.1531 if the price consolidates above the area of 1.1461-1.1466. We would still not expect strong movements.
On the 5-minute timeframe, the following levels should be considered: 1.1267-1.1275, 1.1363-1.1377, 1.1461-1.1466, 1.1527-1.1531, 1.1584-1.1594, 1.1655-1.1666, 1.1745-1.1754. No significant events or publications are scheduled in the Eurozone and the U.S. on Monday. Thus, traders will have nothing to react to throughout the day, and movements may again be very weak.
Price levels (areas) of support and resistance are targets when opening long or short positions or sources of signals.
Red lines indicate channels or trend lines that display the current trend and indicate the preferred direction for trading.
The MACD indicator (14,22,3) – histogram and signal line – is a supplementary indicator that can also be used as a source of signals.
Important speeches and reports (contained in the news calendar) can significantly impact the movement of the currency pair. Therefore, during their release, trading should be conducted with maximum caution, or one should exit the market to avoid sharp reversals against preceding movements.
Beginners trading in the forex market should remember that not every trade can be profitable. Developing a clear strategy and practicing money management are key to long-term success in trading.
¡Los informes analíticos de InstaForex lo mantendrá bien informado de las tendencias del mercado! Al ser un cliente de InstaForex, se le proporciona una gran cantidad de servicios gratuitos para una operación eficiente.


