 Permanecer

Condiciones de negociación
Products
Herramientas


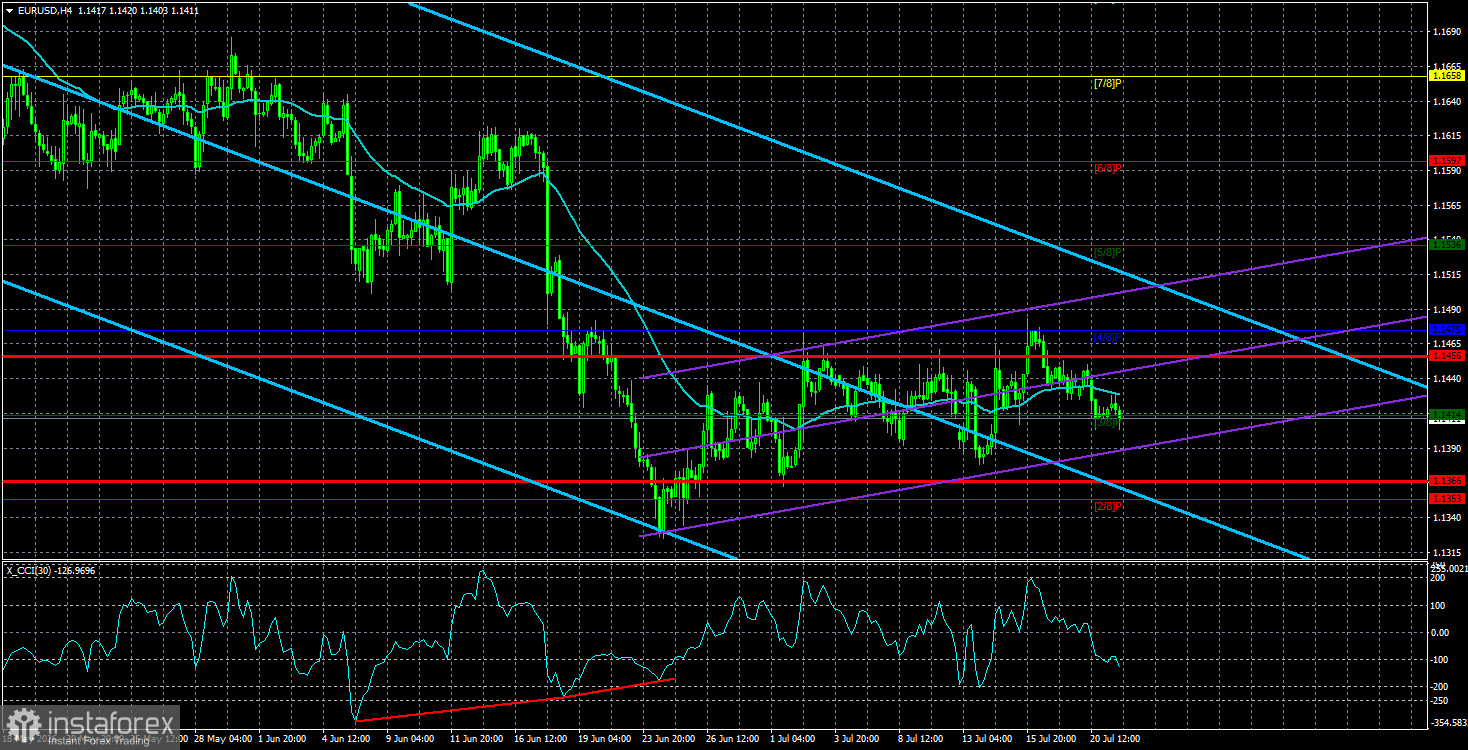
The EUR/USD currency pair showed no interesting movements on Tuesday. With smiles on our faces, we watch as some experts explain the current price fluctuations, which can only be described as "convulsions." Almost every day, the volatility of the pair approaches minimal levels, indicating only one thing – there is no desire to trade in the market right now. The most logical explanation for this is the complete uncertainty associated with the conflict in the Middle East, oil prices, inflation, and, consequently, the monetary policy of central banks. All the movements we have observed in recent weeks can be characterized by three different theses. Let's break down each of them.
Correction. A correction after another round of strong strengthening of the US dollar was brewing. This is clearly visible on the 4-hour timeframe. Thus, the European currency has been crawling upward in recent weeks solely based on technical grounds. The market has been slowly realizing profits on short positions but has not rushed to open long positions. Therefore, trading volumes are currently minimal.
Flat. Despite the presence of an upward inclination in the last movement, the price spends most of its time between the levels of 1.1377 and 1.1461. Therefore, the current movement can be viewed as both a correction and a flat, which does not change the essence of the matter.
Market Noise. Since the movements are mostly extremely weak, we do not believe they are related to the market's reaction to various events. Simply put, if after a sensational inflation report in the US (for example) the price moves 20 pips, can we consider this movement a "market reaction"? In our opinion, no. In most cases, we observe such movements of 20-30 pips that would happen even without the influence of macroeconomics and fundamentals.
Thus, the conclusion can be obvious but not suitable for everyone. The current movement is a correction, and after the correction is complete, the trend resumes. We do not support further growth of the US dollar, but a month ago, the dollar did not have sufficient grounds for an increase of another 300 pips in just a couple of days. The market frequently experiences illogical movements, and they happen quite often. Right now, the technical picture on the 4-hour timeframe looks like preparation for a new round of the three-month trend.
Moreover, this week will see a European Central Bank meeting, during which interest rates are unlikely to be raised for the second consecutive time. Geopolitics remains negative, which may provide background support for the US dollar. Let's say that the formal reasons for the market to buy the dollar are present. Or they can be easily found. To reiterate: corrections are usually weak, prolonged, and exhausting, while trends are sharp and strong. What we are observing now clearly does not resemble a trend.
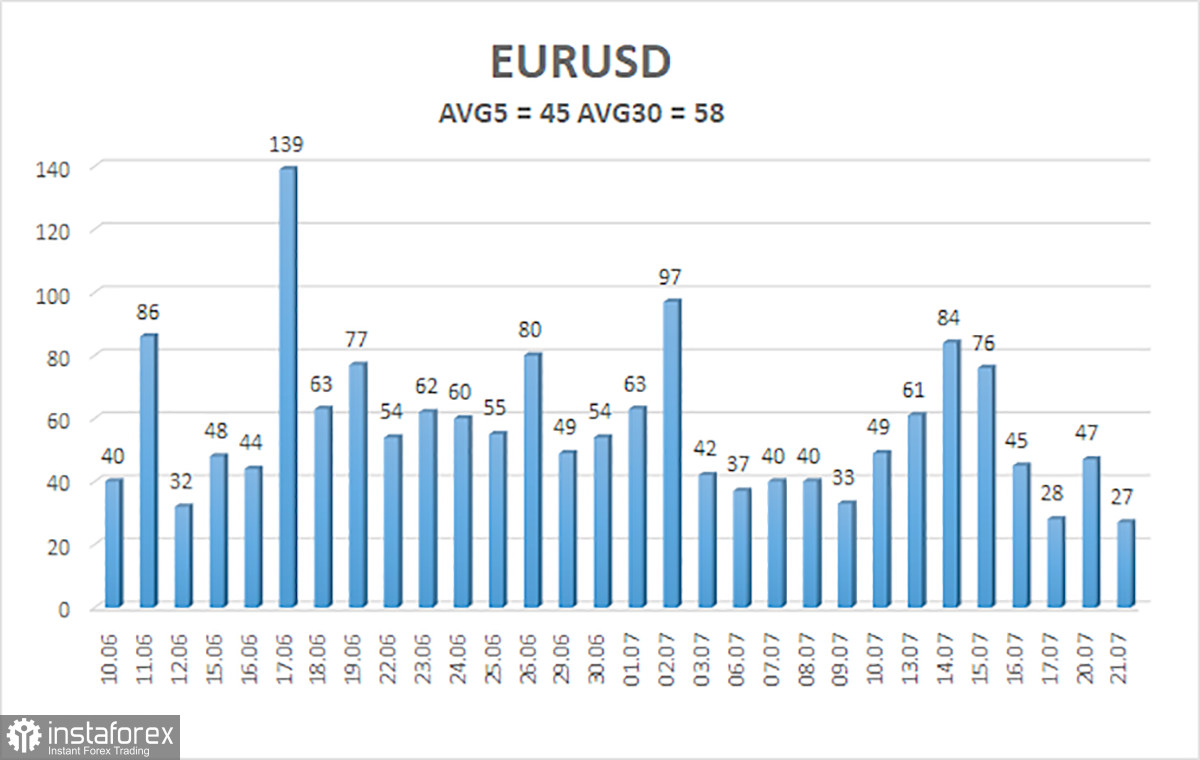
The average volatility of the EUR/USD currency pair over the last 5 trading days as of July 22 is 45 pips and is characterized as "low." We expect the pair to move between 1.1366 and 1.1456 on Wednesday. The upper channel of linear regression is pointing downwards, indicating the continuation of the downward trend. The CCI indicator has entered the oversold area and has formed two "bullish" divergences, which signal a possible end to the downward trend.
S1 – 1.1414
S2 – 1.1353
S3 – 1.1292
R1 – 1.1475
R2 – 1.1536
R3 – 1.1597
The EUR/USD pair maintains a downward trend, which is presumably a correction within a global upward trend, as clearly seen on the daily or weekly timeframe. The global fundamental backdrop for the dollar remains negative, but in 2026, initially geopolitics, and then the "hawkish" stance of the Federal Reserve provided strong support for the US dollar. When the price is located below the moving average, short positions can be considered with targets of 1.1366 and 1.1353. Above the moving average line, long positions are relevant with targets of 1.1456 and 1.1475. The market has been in a flat for the fourth consecutive week.
The channels of linear regression help determine the current trend. If both are pointed in one direction, it means the trend is currently strong.
The moving average line (settings 20,0, smoothed) determines the short-term trend and the direction in which trading should currently be conducted.
Murray levels are target levels for movements and corrections.
Volatility levels (red lines) are the likely price channel in which the pair will spend the next day, based on current volatility metrics.
The CCI indicator's entry into the oversold area (below -250) or into the overbought area (above +250) indicates that a trend reversal in the opposite direction is approaching.
¡Los informes analíticos de InstaForex lo mantendrá bien informado de las tendencias del mercado! Al ser un cliente de InstaForex, se le proporciona una gran cantidad de servicios gratuitos para una operación eficiente.


