 Permanecer

Condiciones de negociación
Products
Herramientas


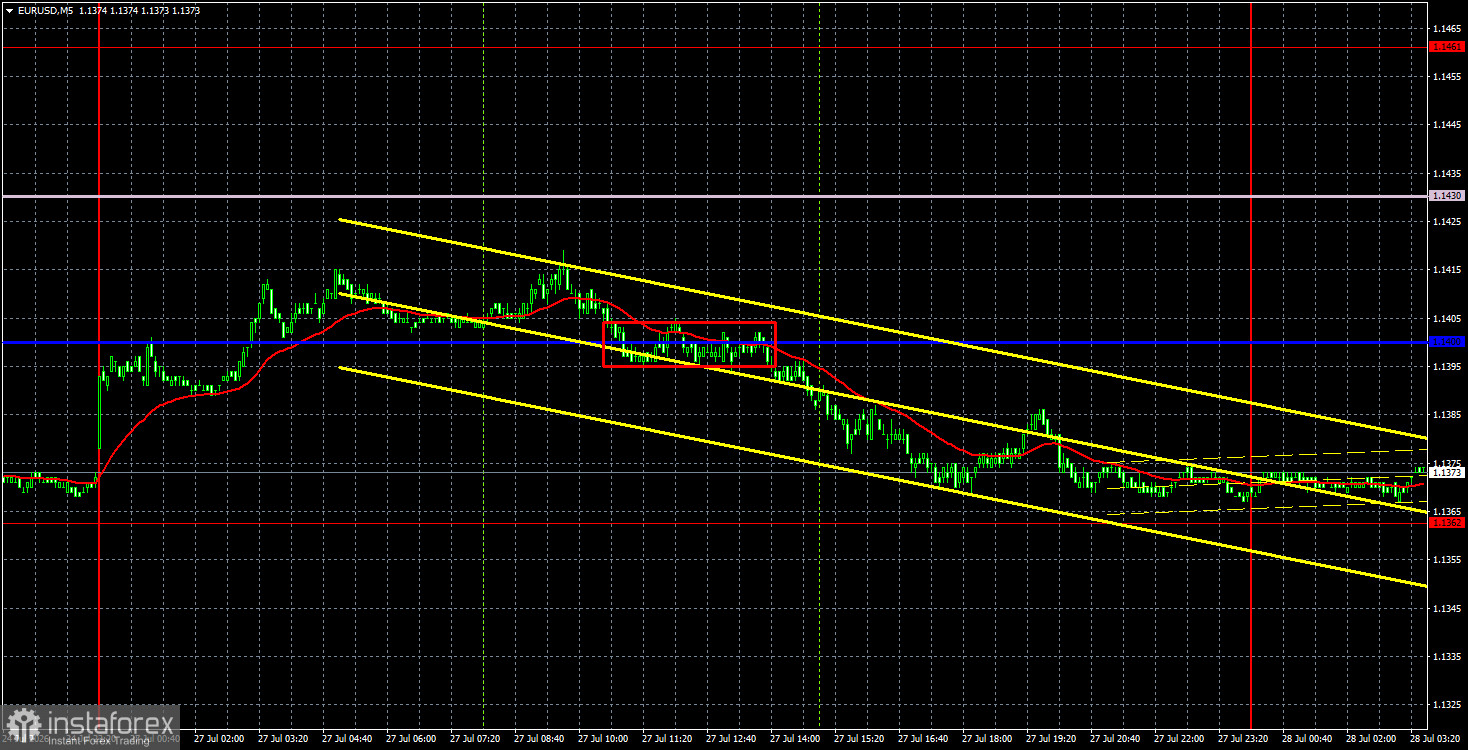
On Monday, the EUR/USD currency pair exhibited movements that few anticipated. At the beginning of the day, the euro started to rise after two reversals near the lower boundary of the sideways channel at 1.1362-1.1461 established last week. It seemed logical, and the euro received backing from geopolitical factors as the two-week US attacks on Iran ceased. Iran and Oman began working on opening the Strait of Hormuz. However, the market found nothing optimistic in these developments, leading to a renewed strengthening of the US dollar by the morning. Essentially, the market was simultaneously right and wrong. On one hand, a ceasefire or new negotiations mean absolutely nothing. The conflict remains unresolved and intermittently flares up and then cools down simply because the parties are not interested in engaging in continuous hostilities.
On the other hand, the dollar is rising in 2026 purely due to geopolitical factors, which cannot support it indefinitely. The price has been in a flat range for a month, and movements should only be expected between the levels of 1.1362 and 1.1461 until that flat is broken. From a third standpoint, the euro cannot show growth even when there are reasons to do so, as the market ignores all positive factors for the euro.
Technically, the pair maintains a minimal upward bias but is essentially trapped in a flat for a month. Since the price dropped to the lower boundary of the sideways channel, it is reasonable to expect either the completion of the flat or a rebound from it, leading to new movement towards the upper boundary at 1.1461. For now, we lean towards the latter scenario.
On the 5-minute timeframe on Monday, one sell signal was generated. It should be noted that the lines of the Ichimoku indicator in the flat are weak, but there are no other signals at the moment. During the European trading session, the price crossed the Kijun-sen line, leading to a drop to the level of 1.1362.
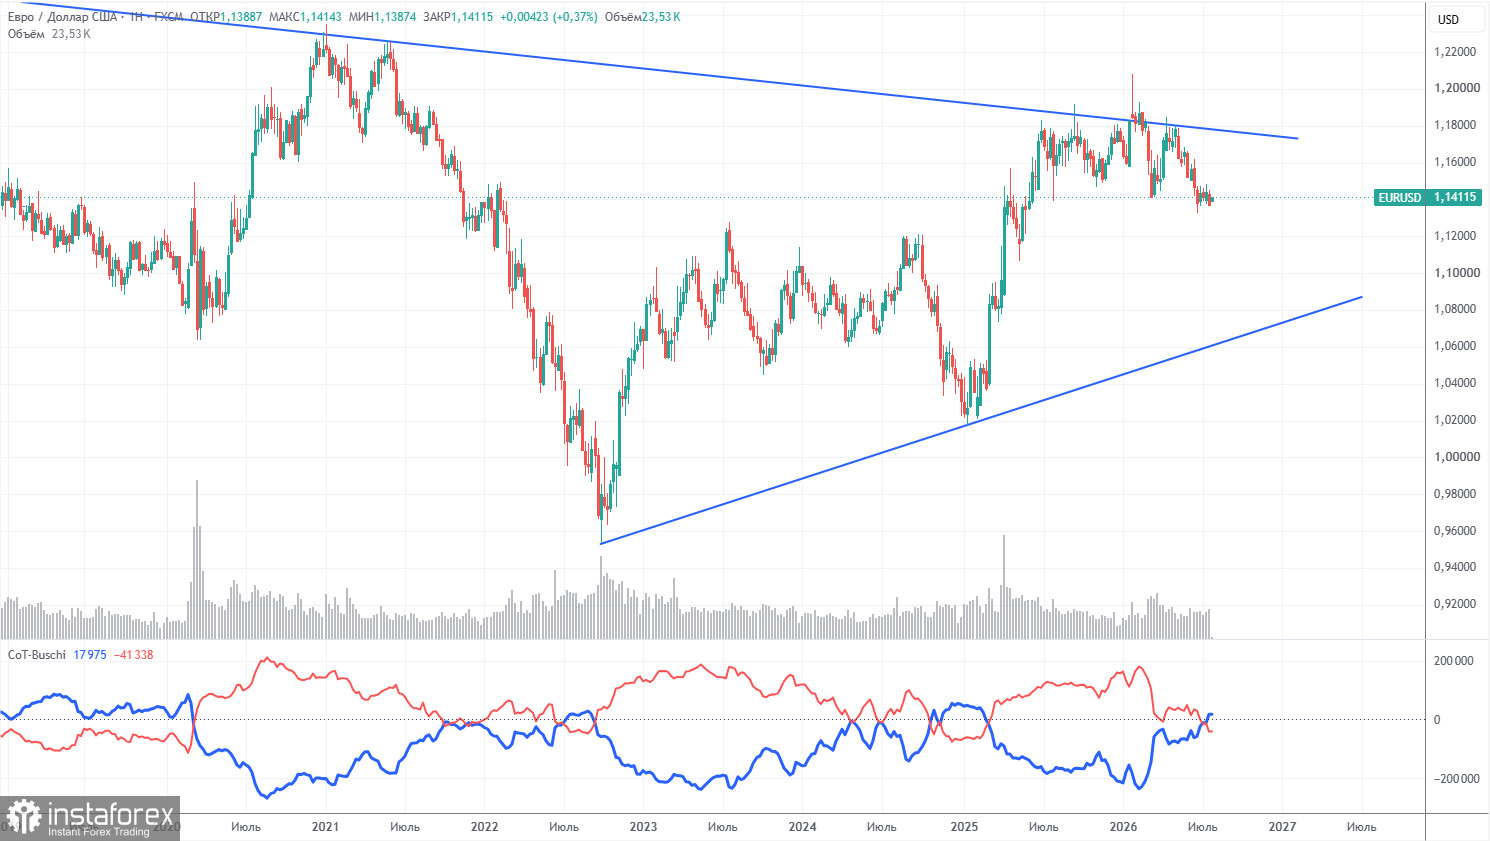
The latest COT report is dated July 21. The weekly timeframe illustration shows that the net position of non-commercial traders has become bearish and has significantly decreased due to geopolitical events. Traders have been shedding the euro in favor of the US dollar over the last few months. Donald Trump's policy has not changed, but for some time the dollar has served as a "reserve currency."
We still do not see any fundamental factors for strengthening the euro, while there are plenty of factors for the decline of the US dollar. The war in the Middle East has temporarily made the dollar super attractive, but once that factor's "shelf life" expires, everything will return to the status quo. In the long term, the euro may fall as low as 1.08$ (the trend line), but the upward trend will remain relevant. Over recent months of dollar growth, the pair has not approached that line significantly.
The positioning of the red and blue lines of the indicator indicates a balance between bulls and bears. Over the last reporting week, the number of longs among the "Non-commercial" group decreased by 9,800, while the number of shorts increased by 18,900. Consequently, the net position decreased by 28,700 contracts in one week.
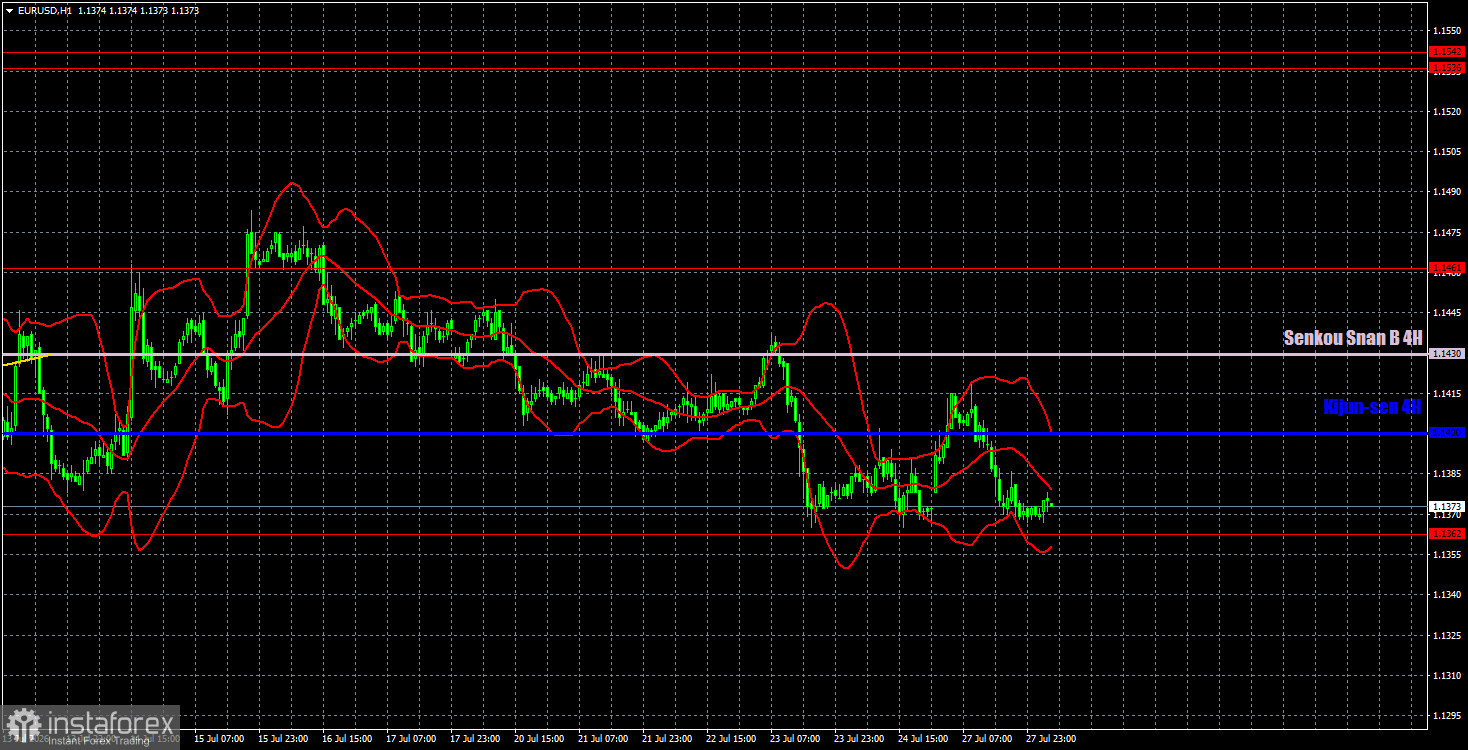
On the hourly timeframe, a corrective upward trend continues to form, which is essentially a flat. The situation in the Middle East remains tense and is not improving. The market continues to ignore many factors that favor the euro, preventing it from showing any growth. The European Central Bank meeting and the central bank's hawkish stance have been overlooked for the second consecutive time.
For July 28, we highlight the following levels for trading: 1.1234, 1.1274, 1.1362-1.1368, 1.1461, 1.1536-1.1542, 1.1585, 1.1657-1.1666, 1.1750-1.1760, 1.1786, 1.1830-1.1837, as well as the Senkou Span B (1.1430) and Kijun-sen (1.1400) lines. The lines of the Ichimoku indicator may shift during the day, which should be considered when determining trading signals. Don't forget to set a Stop Loss order to break even if the price moves in the correct direction by 15 pips. This will protect against potential losses if the signal turns out to be false.
On Tuesday, there are no significant events or reports planned in the EU or the US. As a result, volatility is unlikely to be high today, and the euro is unlikely to leave the sideways channel in which it has been for a month.
Today, traders may consider short positions with a target of 1.1274 if the price fixes below the area of 1.1362-1.1368. A new rebound from the area of 1.1362-1.1368 would allow for opening long positions with targets at 1.1400 and 1.1430.
Support and resistance levels are indicated by thick red lines, near which the movement may come to an end. They are not sources of trading signals.
The Kijun-sen and Senkou Span B lines are Ichimoku indicator lines transferred to the hourly timeframe from the 4-hour one. They are strong lines.
Extreme levels are indicated by thin red lines, from which the price previously bounced. They are sources of trading signals.
Yellow lines represent trend lines, trend channels, and any other technical patterns.
Indicator 1 on the COT charts represents the size of the net position for each category of traders.
¡Los informes analíticos de InstaForex lo mantendrá bien informado de las tendencias del mercado! Al ser un cliente de InstaForex, se le proporciona una gran cantidad de servicios gratuitos para una operación eficiente.


