 Permanecer

Condiciones de negociación
Products
Herramientas


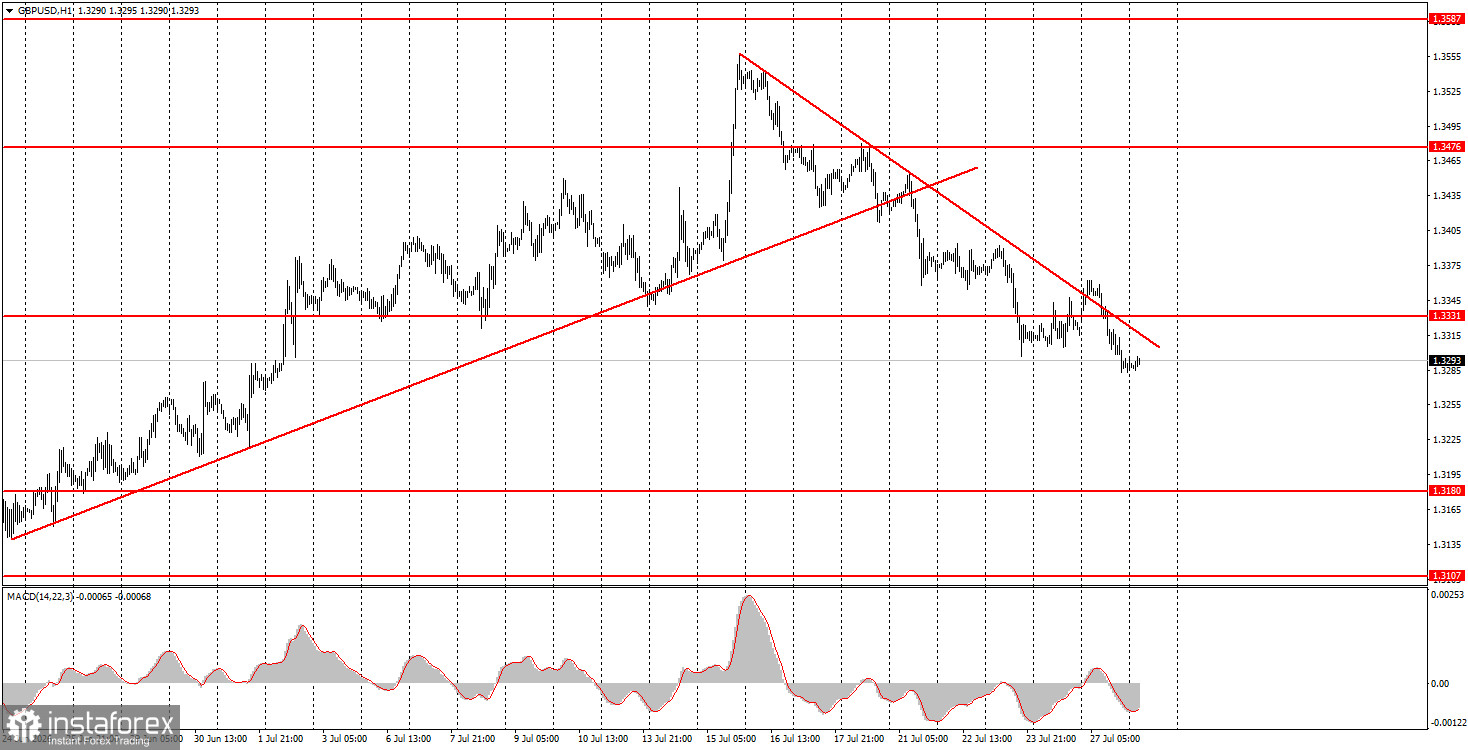
On Monday, the GBP/USD pair unexpectedly dropped, even though the descending trendline was broken the same day. Certainly, such technical signals can sometimes be false. Still, it seems logical that with a weak report on durable goods orders in the US and a slight decrease in the geopolitical tension of the conflict in the Middle East, the British currency would be more likely to rise. The market deciphered this puzzle in its own way yet again, but we would still not ignore the fact of the trendline break. Sometimes a trendline can be breached while the price continues to move primarily in the same direction for a while before turning. Moreover, the euro currency has yet to overcome the 1.1366-1.1377 area and exit the sideways channel through its lower boundary. Despite the weakness of the bulls and the ongoing pressure from the bears, the dollar also cannot grow indefinitely based on a single factor. We believe that both the euro and the pound are currently in very promising positions for long positions. However, everything will depend on technical signals.
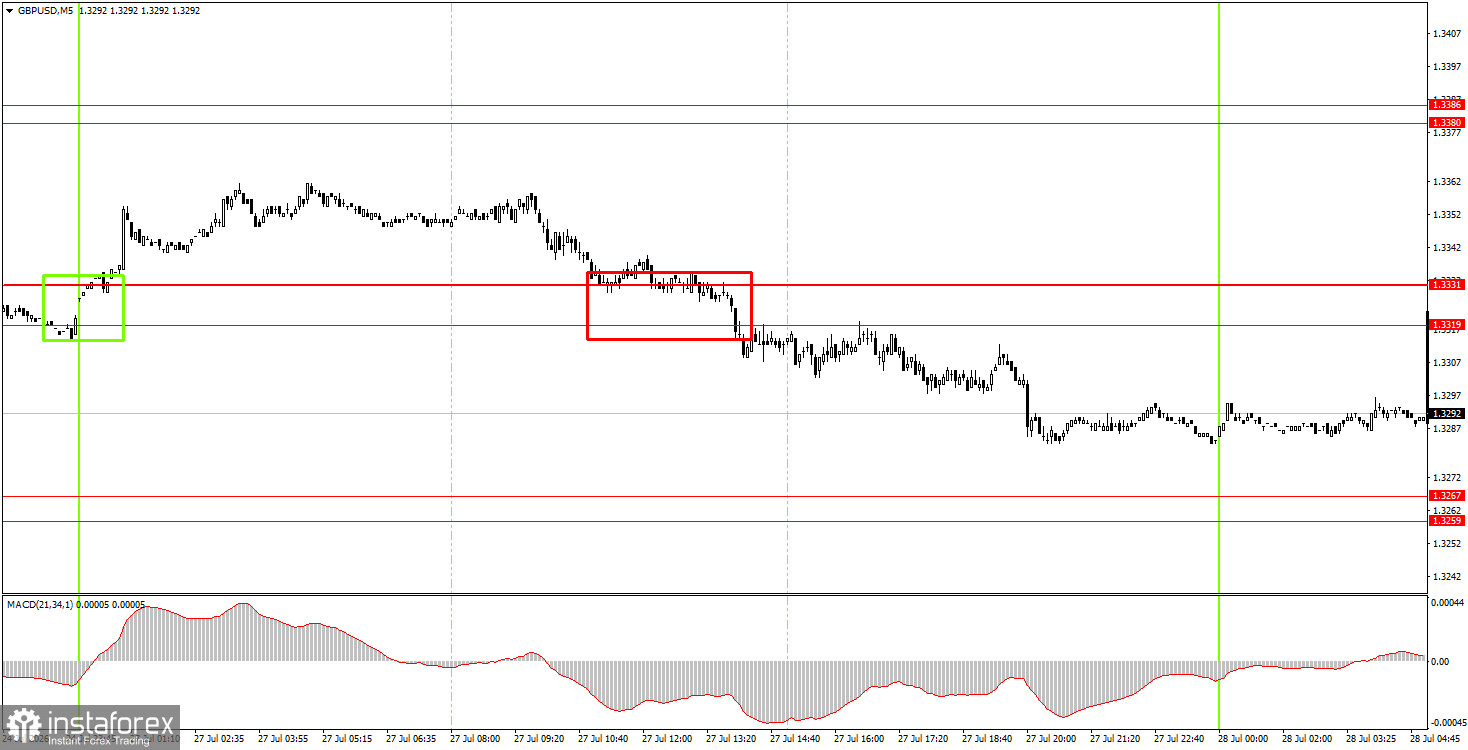
On the 5-minute timeframe, a sell trading signal was formed on Monday when the price breached the area of 1.3319-1.3331. We are not confident in the continued decline of the British currency since we do not currently see valid reasons for it. However, reasons may arise on Wednesday or Thursday when the Federal Reserve and the Bank of England hold their meetings.
On the hourly timeframe, the GBP/USD pair may begin a new upward trend. After three weeks of rising, a correction was necessary, but it may be nearing its conclusion. Technically, any rise in the British currency in the coming days and weeks would be entirely justified.
On Tuesday, novice traders may open short positions if the price settles below the area of 1.3259-1.3267 with a target of 1.3175-1.3180. Longs can be considered on a rebound from the area of 1.3259-1.3267 or if the price settles above the area of 1.3319-1.3331.
On the 5-minute timeframe, traders can currently focus on the levels of 1.3096-1.3107, 1.3175-1.3180, 1.3259-1.3267, 1.3319-1.3331, 1.3380-1.3386, 1.3456-1.3476, 1.3587-1.3598, 1.3631-1.3641, and 1.3695. On Tuesday, there are no significant events or publications scheduled in the UK or the US, so traders will have little to react to throughout the day. Consequently, trading will have to rely solely on technical factors today.
Price levels (areas) of support and resistance are targets when opening long or short positions or sources of signals.
Red lines indicate channels or trend lines that display the current trend and indicate the preferred direction for trading.
The MACD indicator (14,22,3) – histogram and signal line – is a supplementary indicator that can also be used as a source of signals.
Important speeches and reports (contained in the news calendar) can significantly impact the movement of the currency pair. Therefore, during their release, trading should be conducted with maximum caution, or one should exit the market to avoid sharp reversals against preceding movements.
Beginners trading in the forex market should remember that not every trade can be profitable. Developing a clear strategy and practicing money management are key to long-term success in trading.
¡Los informes analíticos de InstaForex lo mantendrá bien informado de las tendencias del mercado! Al ser un cliente de InstaForex, se le proporciona una gran cantidad de servicios gratuitos para una operación eficiente.


