 Permanecer

Condiciones de negociación
Products
Herramientas


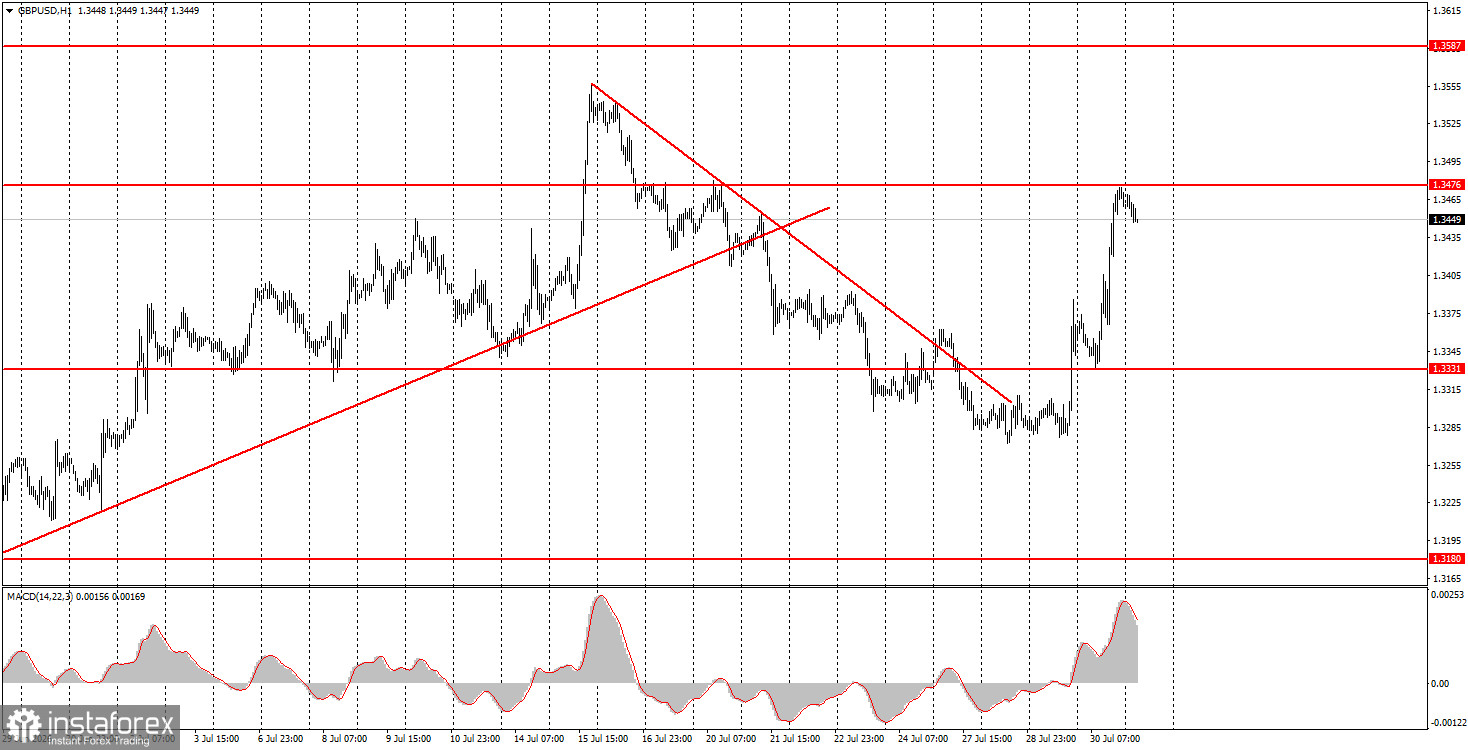
The GBP/USD pair also showed confident growth throughout Thursday, driven by the Bank of England's stance and a disappointing US GDP report for the second quarter. Essentially, yesterday sent the dollar into a knockout, and the market finally opened its eyes and realized that not all factors currently support the American currency. For instance, the BoE and the European Central Bank are much closer to tightening monetary policy than the Federal Reserve. The US economy is slowing, and it will slow further if the Fed starts tightening policy. The US labor market may hold back the Fed's hawkish impulses in the coming months. Geopolitics remains ambiguous, so making any forecasts about inflation is pointless. We believe that now is the time to work with actual information rather than expectations. It is also important not to forget about the higher time frames, where the outlook for the British pound is quite positive. The upward trend from 2022 remains intact, and the pair has begun moving from the lower boundary of the yearly sideways channel to the upper boundary.
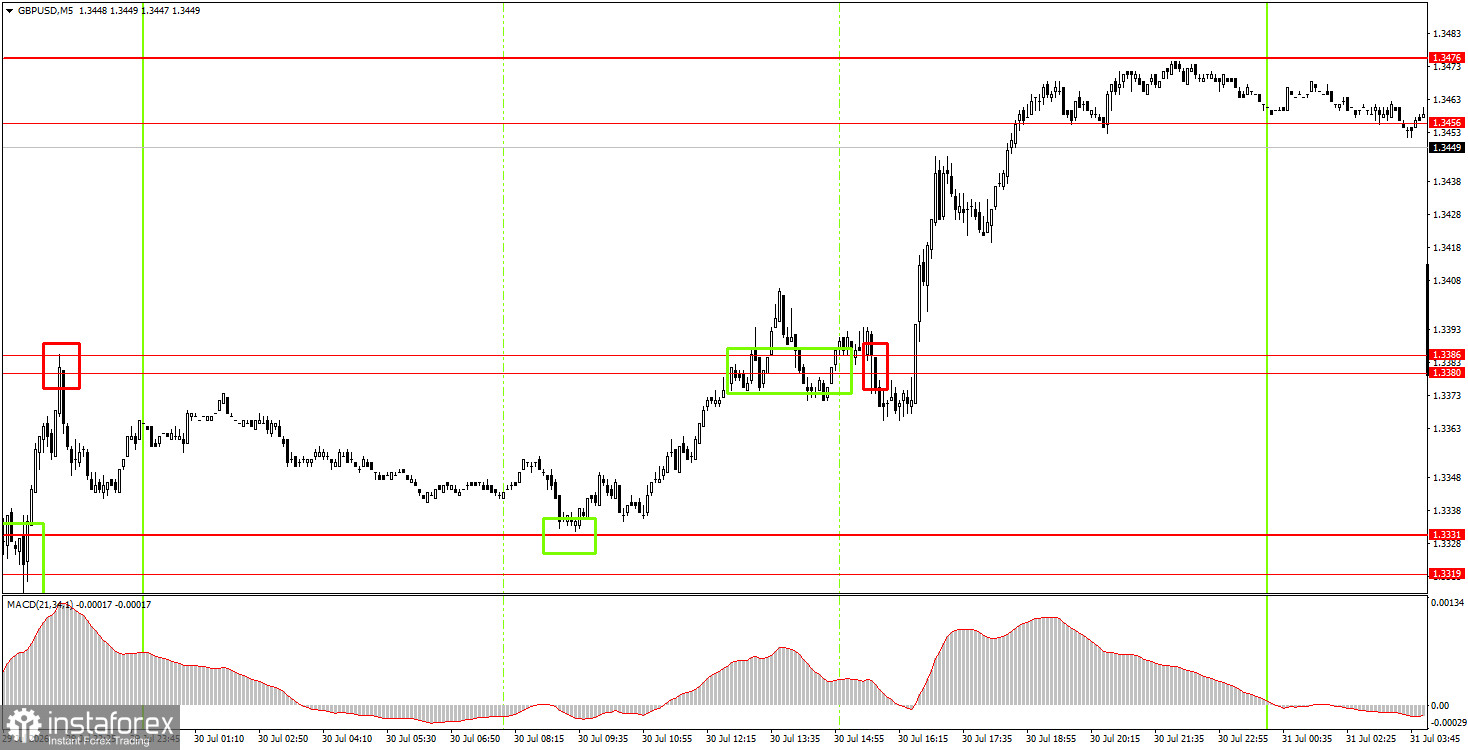
On the 5-minute time frame on Thursday, several trading signals were generated. All buy signals were profitable and marked with green rectangles. Unfortunately, before the new phase of growth, a sell signal formed that proved to be false and resulted in losses for traders. However, two long positions yielded good profits and offset the loss from the short position.
On the hourly time frame, the GBP/USD pair has begun a new upward trend. In our view, the British pound will continue to rise even if local factors do not support it. On the weekly time frame, the move from the lower boundary of the sideways channel to the upper boundary began a month ago, and it is not yet complete. The Fed did not support the dollar, and geopolitics cannot sustain it forever, so we see no reason for further strengthening of the American currency.
On Friday, novice traders may open short positions if the price bounces from the 1.3456-1.3476 area, targeting 1.3380-1.3386. Long positions can be considered if the price breaks through the 1.3456-1.3476 area, targeting 1.3587-1.3598.
On the 5-minute time frame, trading can currently be done at levels such as 1.3096-1.3107, 1.3175-1.3180, 1.3259-1.3267, 1.3319-1.3331, 1.3380-1.3386, 1.3456-1.3476, 1.3587-1.3598, 1.3631-1.3641, and 1.3695. On Friday, there are no significant events scheduled in the UK, while the US will release only the second estimate of the University of Michigan's Consumer Sentiment Index.
Price levels (areas) of support and resistance are targets when opening long or short positions or sources of signals.
Red lines indicate channels or trend lines that display the current trend and indicate the preferred direction for trading.
The MACD indicator (14,22,3) – histogram and signal line – is a supplementary indicator that can also be used as a source of signals.
Important speeches and reports (contained in the news calendar) can significantly impact the movement of the currency pair. Therefore, during their release, trading should be conducted with maximum caution, or one should exit the market to avoid sharp reversals against preceding movements.
Beginners trading in the forex market should remember that not every trade can be profitable. Developing a clear strategy and practicing money management are key to long-term success in trading.
¡Los informes analíticos de InstaForex lo mantendrá bien informado de las tendencias del mercado! Al ser un cliente de InstaForex, se le proporciona una gran cantidad de servicios gratuitos para una operación eficiente.


