 Permanecer

Condiciones de negociación
Products
Herramientas


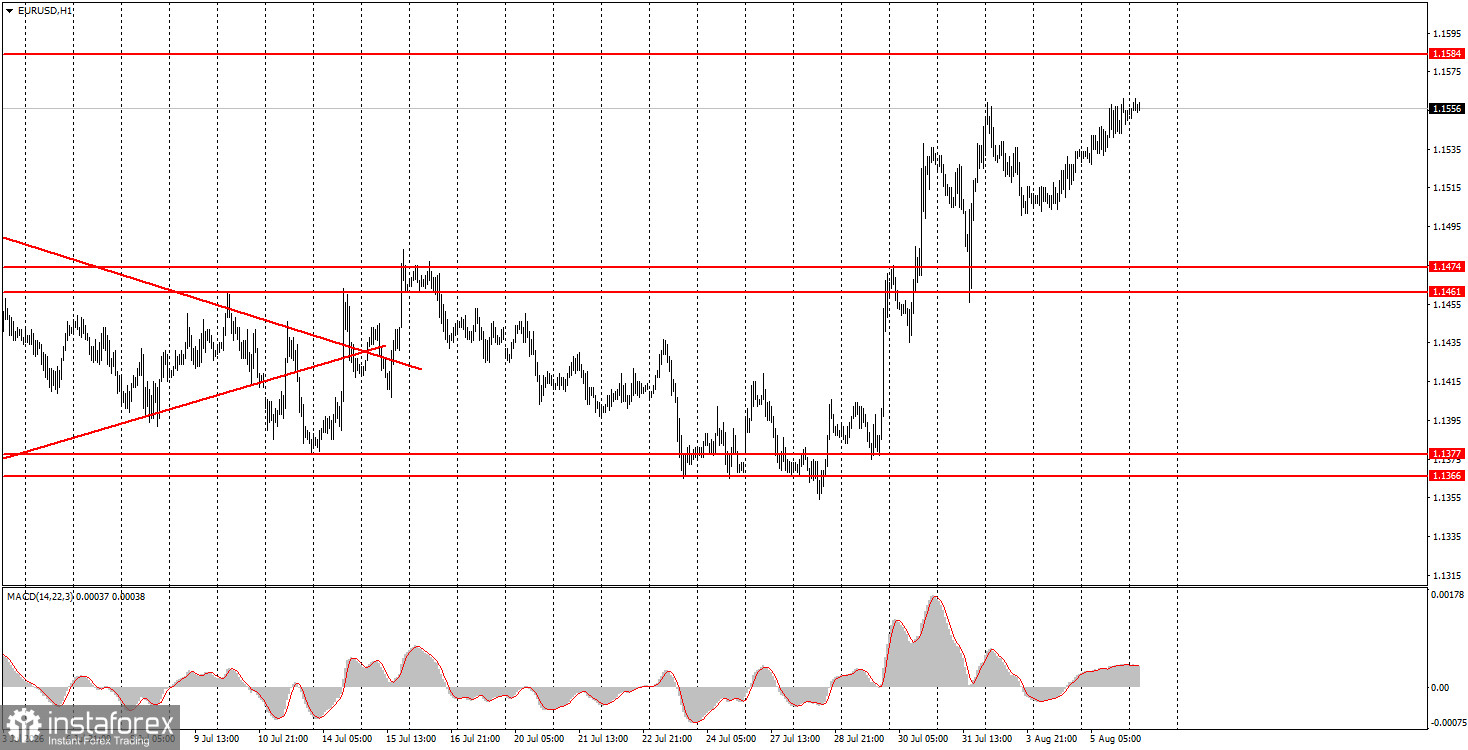
The EUR/USD currency pair continued its move toward 1.1584 on Wednesday after bouncing off the 1.1461–1.1474 area and completing a month-long flat. Thus, the euro continues its entirely justified rise, driven by global, technical, and fundamental factors. This week, three out of four U.S. reports have been weaker than the market expected. In addition, traders are beginning to lose faith in the Federal Reserve, which remains effectively unprepared to tighten monetary policy despite high inflation. Confidence in Kevin Warsh is beginning to wane. The market doubts that policy under Warsh will be fair and reflect the interests of society and the economy. Thus the dollar already had few growth drivers, and now even fewer. Previously, geopolitics supported demand for the U.S. currency, but that factor's shelf life has expired or is nearly expired. We expect continued euro appreciation in the medium term. We consider a return to this year's highs the baseline target for the euro.
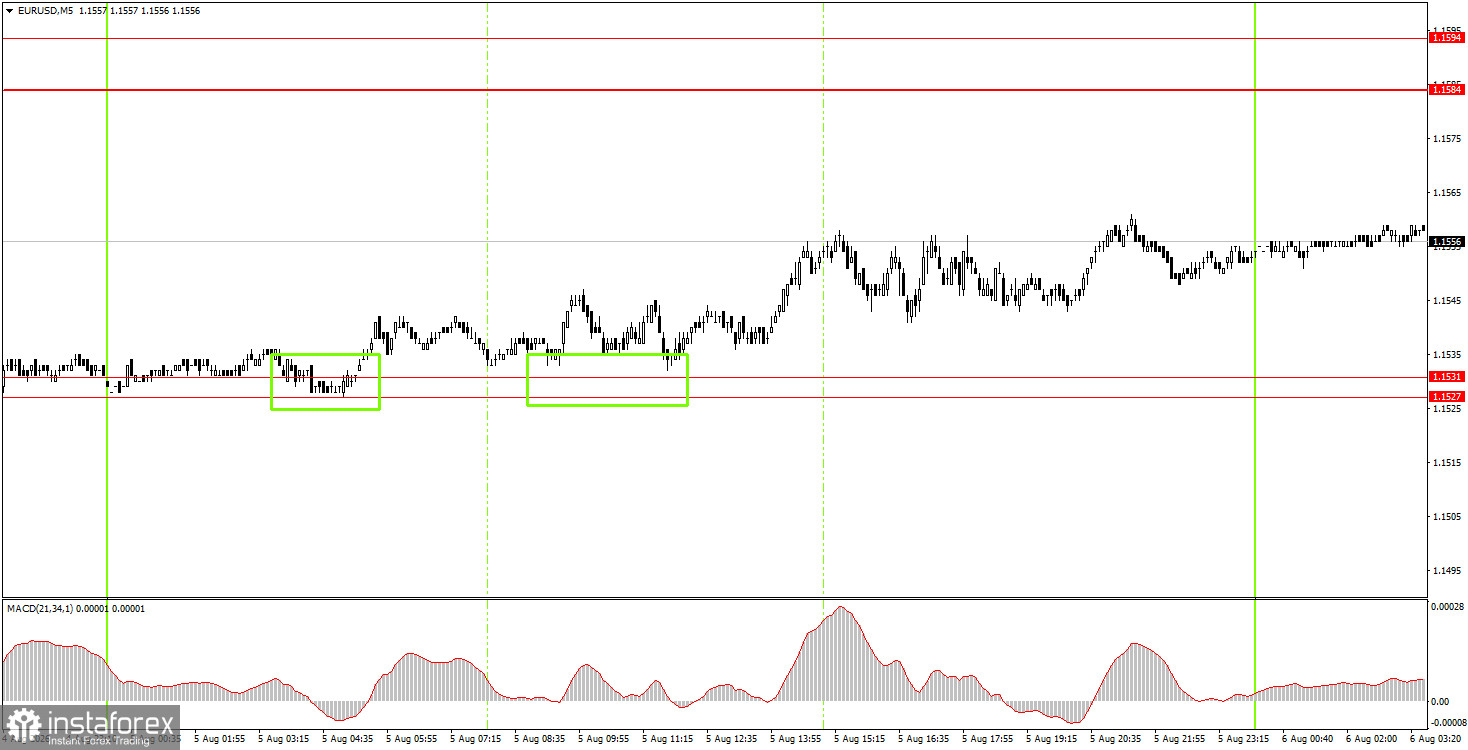
On the 5?minute TF on Wednesday, two trading signals were formed. First, during the Asian session, and then during the European session, the pair bounced twice off the 1.1527–1.1531 area, allowing novice traders to open long positions. Those longs could be carried into Thursday because volatility is again low and more time is needed to realize profit on the trade.
On the hourly timeframe, the price has left the sideways channel it spent a month in and is now forming a new upward trend. Considering all events in the world over recent months, we believe the euro should continue to rise steadily. Lately the market has diligently ignored almost all factors in favor of the euro, so a "consolidation" is now underway to bring the exchange rate to fair value.
On Thursday, novice traders may open short positions targeting 1.1527–1.1531 if the price bounces from the 1.1584–1.1594 area. Long positions can be held after yesterday's bounces from the 1.1527–1.1531 area with targets of 1.1584–1.1594.
On the 5?minute TF, consider the levels 1.1267–1.1275, 1.1366–1.1377, 1.1461–1.1474, 1.1527–1.1531, 1.1584–1.1594, 1.1655–1.1666, 1.1745–1.1754. On Thursday, the EU calendar has one publication scheduled — retail sales — and the U.S. will publish jobless claims. We consider both reports secondary.
Support and resistance price levels (areas) are the targets when opening buy or sell orders or sources of signals.
Red lines denote channels or trend lines that reflect the current trend and indicate in which direction trading is currently favored.
The MACD indicator (14,22,3) – histogram and signal line – is a supporting indicator that can also be used as a source of signals.
Important speeches and reports (as listed in the news calendar) can significantly influence the movement of the currency pair. Therefore, during their release, trading should be approached with utmost caution, or one should exit the market to avoid sharp price reversals against the preceding movement.
Beginners in Forex trading should remember that not every trade can be profitable. Developing a clear strategy and proper money management are essential for long-term trading success.
¡Los informes analíticos de InstaForex lo mantendrá bien informado de las tendencias del mercado! Al ser un cliente de InstaForex, se le proporciona una gran cantidad de servicios gratuitos para una operación eficiente.


