 Permanecer

Condiciones de negociación
Products
Herramientas


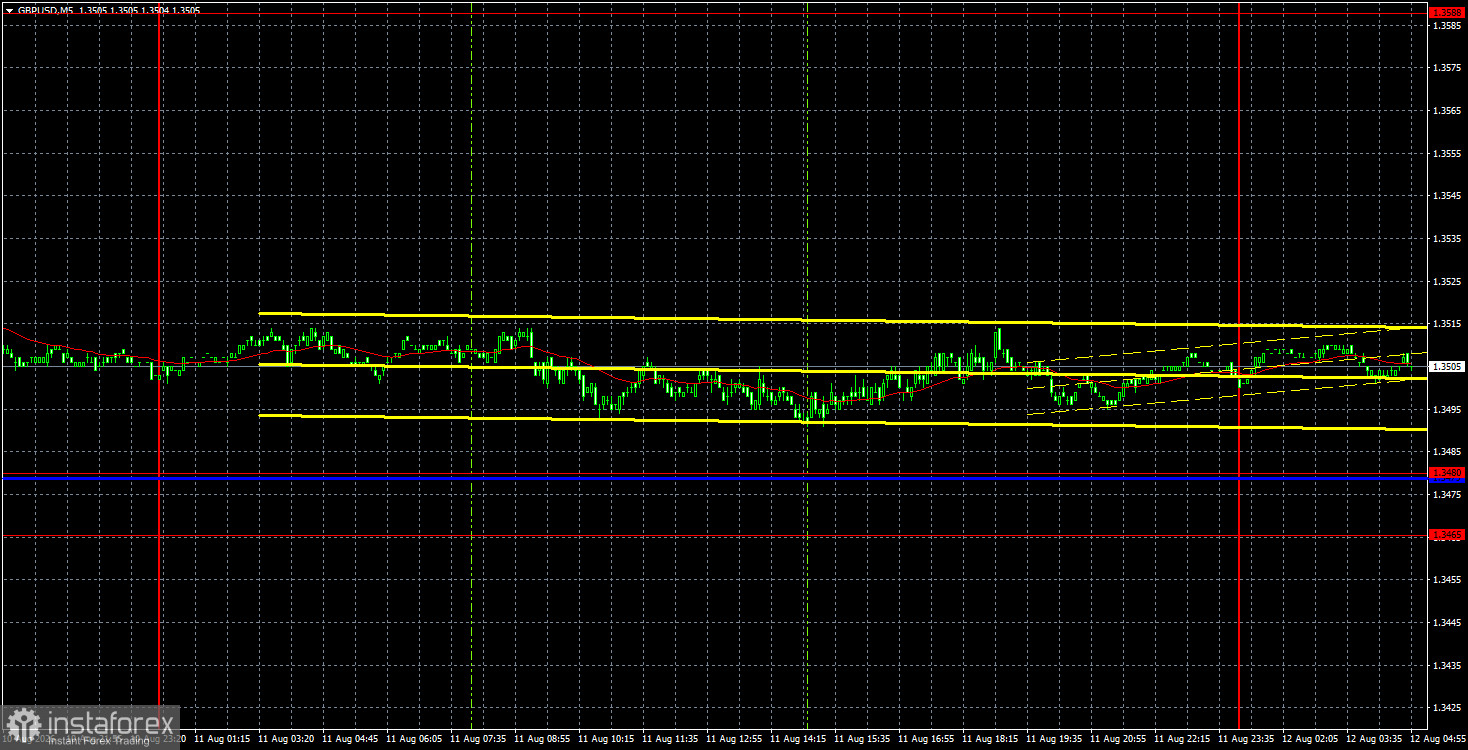
The GBP/USD currency pair also showed absolutely no movement during Tuesday. Volatility amounted to 23 pips, which signifies a complete absence of movement. Moreover, on any timeframe, even the smallest, it is clear that there were no moves yesterday. The macroeconomic background was absent; the market has long stopped reacting to geopolitical news, and there were no important fundamental events. Essentially, everything now boils down to the US inflation report, which will be released later today. However, even this report will not be able to put the final dots. The point is that even if inflation rises for July, the Federal Reserve is unlikely to tighten monetary policy because of the weak labor market. In addition, before the next Fed meeting, another series of labor market and inflation reports will be released, allowing final conclusions to be drawn. Thus, July's inflation is important, but it will not provide a one-hundred-percent basis for conclusions about the Fed's decision next month.
Technically, the British pound continues to form an upward trend on the hourly timeframe. It should be recalled that in the long term the pair is in a flat, which is clearly visible on the weekly timeframe. After working off the lower boundary of the sideways channel, a quite logical movement toward the upper boundary began, which is not yet complete and may continue for several more weeks.
On the 5-minute timeframe on Tuesday, not a single trading signal was formed. The pair moved exclusively sideways all day with low volatility. Not a single level or line was worked off. There were no reasons to open trades.
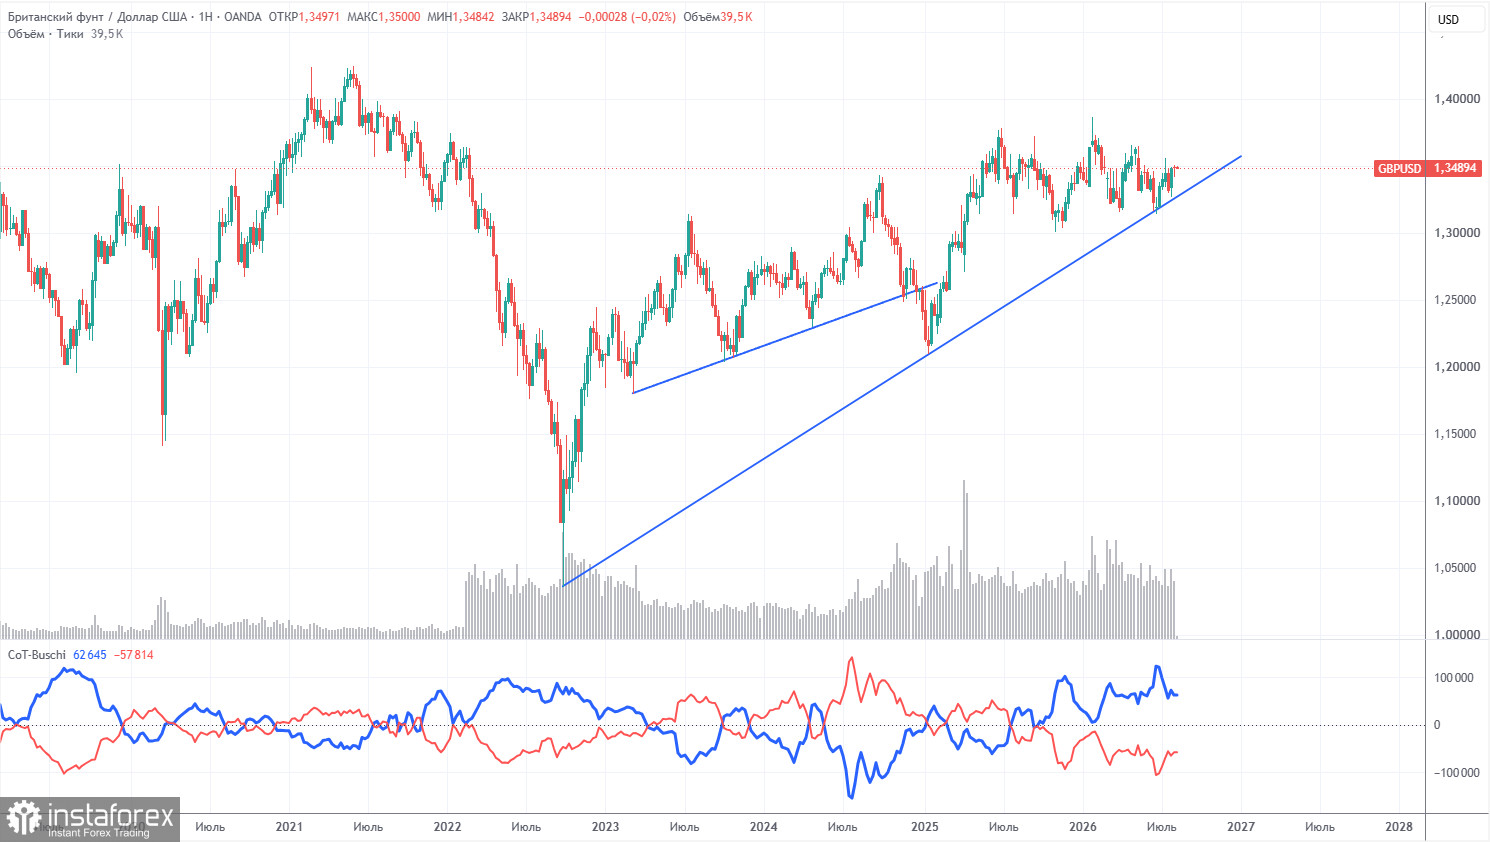
COT reports for the British pound show that non-commercial traders have been dominant on the market with sales for several months now. The net position is negative despite the preservation of the long-term uptrend. Given the events in the Middle East, it is not surprising that demand for risk currencies remains weak. The war is formally over, but the conflict persists. Geopolitics may support demand for the US dollar in the near term. However, until a consolidation below the trend line occurs, we would not count on a strong fall in the pair.
In the long term, the dollar will continue to decline due to Donald Trump's policies, which is clearly visible on the weekly timeframe. The trade war will continue in one form or another for a long time, and Trump's policy is aimed, both directly and indirectly, at weakening the US currency. The long-term uptrend remains relevant, as evidenced by the trend line. The price recently tested that line and bounced off it. According to the latest COT report (dated August 4), the "Non-commercial" group closed 6,500 BUY contracts and 13,500 SELL contracts. Thus, the net position of non-commercial traders increased by 7,000 contracts.
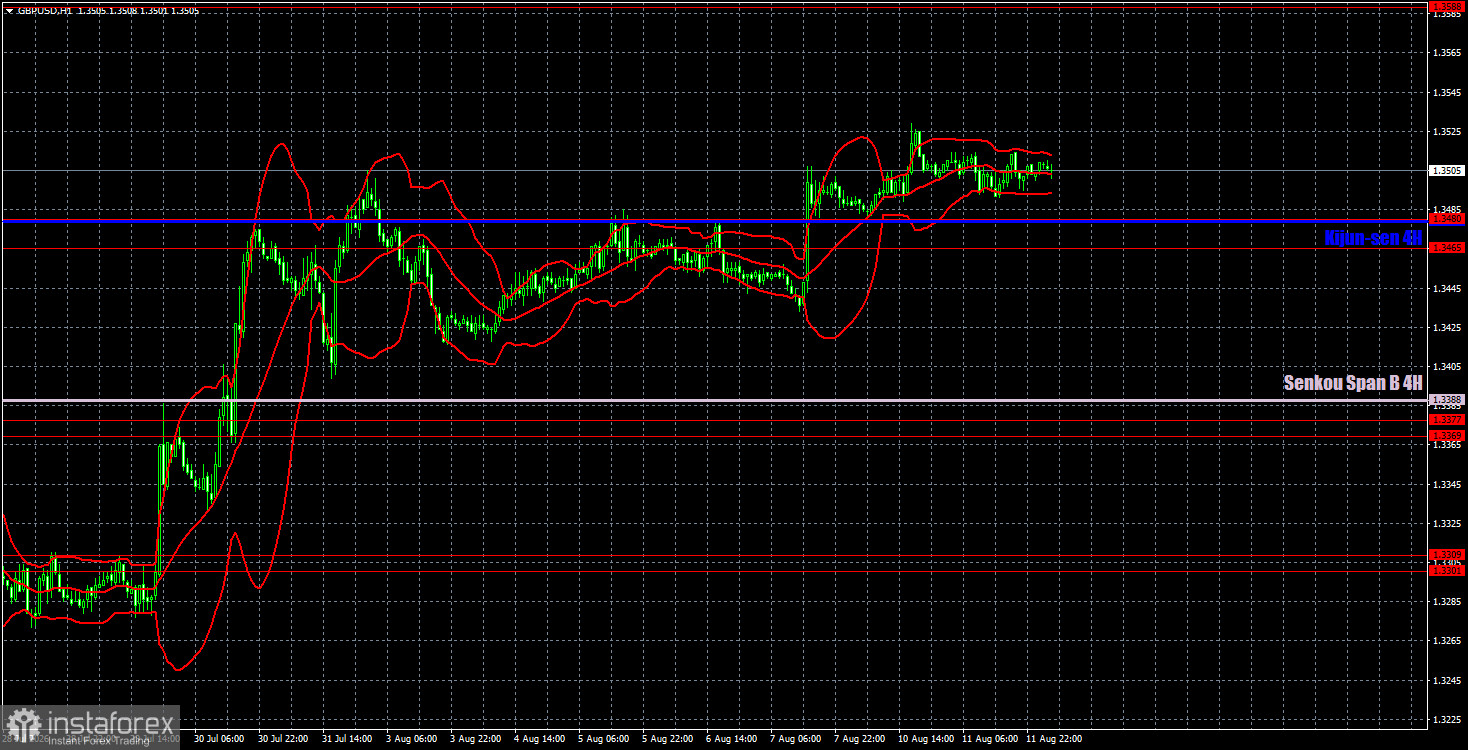
On the hourly timeframe, the GBP/USD pair continues to form an upward trend. In the long term, both European currencies still "look" upward and have been trading within sideways channels for a whole year. This does not negate the upward trend that began back in 2022. We expect the British pound to continue rising in the coming weeks.
For August 12 we highlight the following important levels: 1.3042–1.3050, 1.3096–1.3115, 1.3179–1.3187, 1.3301–1.3309, 1.3369–1.3377, 1.3465–1.3480, 1.3588, 1.3671–1.3681. The Senkou Span B (1.3388) and Kijun-sen (1.3480) lines can also be sources of signals. It is recommended to move the stop loss to breakeven if the price moves 20 pips in the favorable direction. Ichimoku indicator lines may shift during the day, which should be taken into account when determining trading signals.
On Wednesday, the UK economic calendar is empty. At the same time, the US will publish the July inflation report, which traders have been waiting for since last Friday when labor market and unemployment data were released. We believe that the reaction to this report may be strong, and it will be stronger the greater the deviation of the actual value from the forecast.
Today, traders may open short positions with a target of 1.3388 if the price consolidates below the 1.3465–1.3480 area and the Kijun-sen line. Long positions can be opened in the event of a rebound from the 1.3465–1.3480 area with a target of 1.3588.
Price support and resistance levels (resistance/support) – thick red lines near which movement may end. They are not sources of trading signals.
Kijun-sen and Senkou Span B lines – Ichimoku indicator lines transferred from the 4-hour to the hourly timeframe. They are strong lines.
Extreme levels – thin red lines from which price previously bounced. They are sources of trading signals.
Yellow lines – trend lines, trend channels, and any other technical patterns.
Indicator 1 on the COT charts – the size of the net position of each trader category.
¡Los informes analíticos de InstaForex lo mantendrá bien informado de las tendencias del mercado! Al ser un cliente de InstaForex, se le proporciona una gran cantidad de servicios gratuitos para una operación eficiente.


