 Permanecer

Condiciones de negociación
Products
Herramientas


Bitcoin pulled back yesterday down to the $63,200 level. Ether followed it, testing $1,185.1.
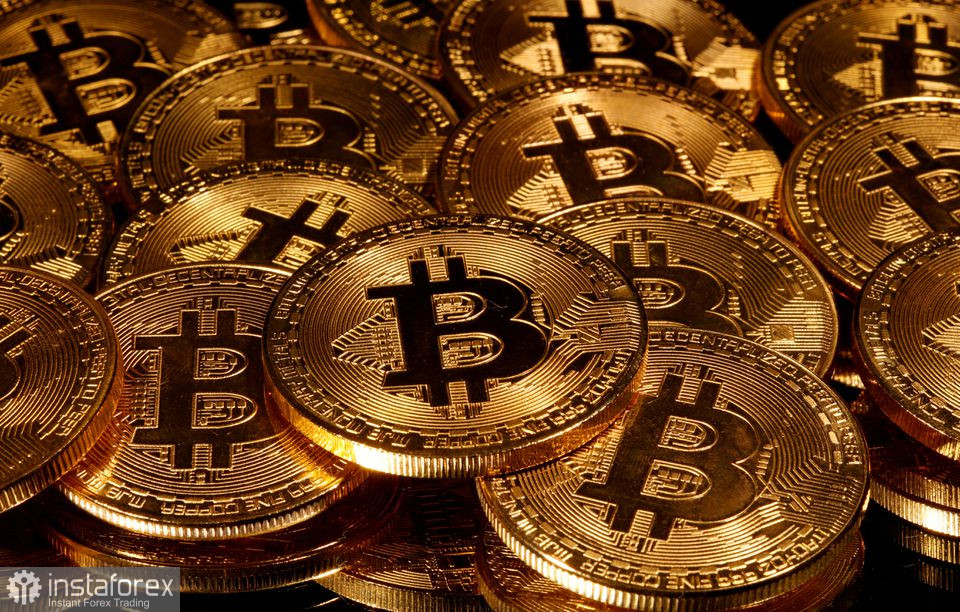
Money began flowing out again. An outflow of $144.67 million from spot Bitcoin ETFs yesterday ended a five-day inflow streak that had delivered the market's best result since April, $853.54 million, last week. Sales were concentrated in a narrow group of the largest products: IBIT from BlackRock lost $53.56 million, GBTC from Grayscale $52.02 million, FBTC from Fidelity $40.32 million, while BITB from Bitwise and EZBC from Franklin Templeton added another $28.44 million and $7.38 million, respectively. The only exception was Grayscale's Bitcoin Mini Trust, which attracted $37.06 million of new funds, while session trading volume totaled $2.03 billion with total category net assets of $78.16 billion. Ether ETFs lost $14.59 million, with most of the outflow coming from BlackRock's ETHA.
Notably, the reversal occurred just a few days after Arkham Intelligence reported that no bitcoin ETF had sold coins throughout August, and on August 3 BlackRock, Fidelity and Franklin Templeton simultaneously purchased the asset — for Franklin Templeton this was the first purchase in more than 30 days. The switch from this purely accumulative dynamic to outflows literally a week later shows how quickly sentiment can change even among the largest institutional products, and the inflow streak, despite a record week for April–August, still failed to offset the broader year-to-date loss — Bitcoin ETFs remain down roughly $4.5 billion at the end of the first half, when the asset lost up to 33% of its value.
The main catalyst in the coming days will be the July US consumer price index release scheduled for today, August 12. These data can determine whether yesterday's outflow was a one-off correction after a week of record inflows or a signal of a broader shift in sentiment ahead of the Federal Reserve's September meeting.
As for short-term trading, the strategy and conditions are described below.
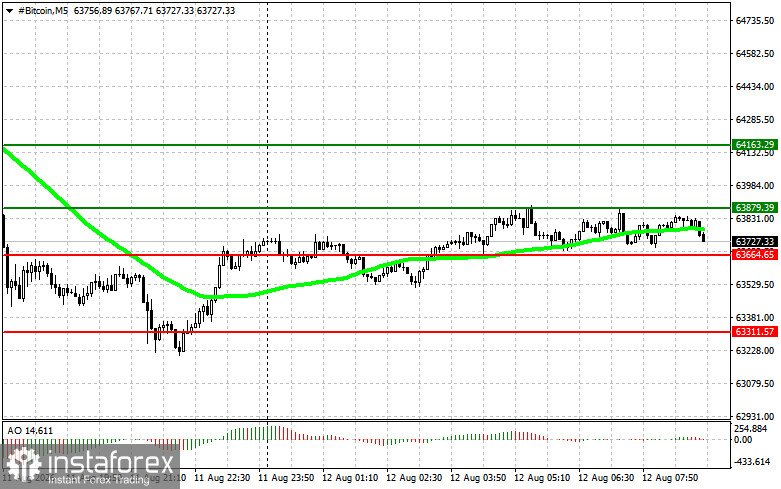
Scenario #1: I will buy bitcoin today if the entry point reaches around $63,900, with a target to rise to $64,200. Around $64,200, I will exit buy positions and sell immediately on the rebound. Before buying on a breakout, make sure the 50-day moving average is below the current price and the Awesome indicator is above zero.
Scenario #2: Bitcoin can be bought from the lower boundary at $63,600 if there is no market reaction to its breakout to the downside, targeting $63,900 and $64,200.
Scenario #1: I will sell bitcoin today if the entry point reaches around $63,600, with a target to fall to $63,300. Around $63,300, I will exit sell positions and buy immediately on the rebound. Before selling on a breakout, make sure the 50-day moving average is above the current price and the Awesome indicator is below zero.
Scenario #2: Bitcoin can be sold from the upper boundary at $63,800 if there is no market reaction to its breakout to the upside, targeting $63,600 and $63,300.
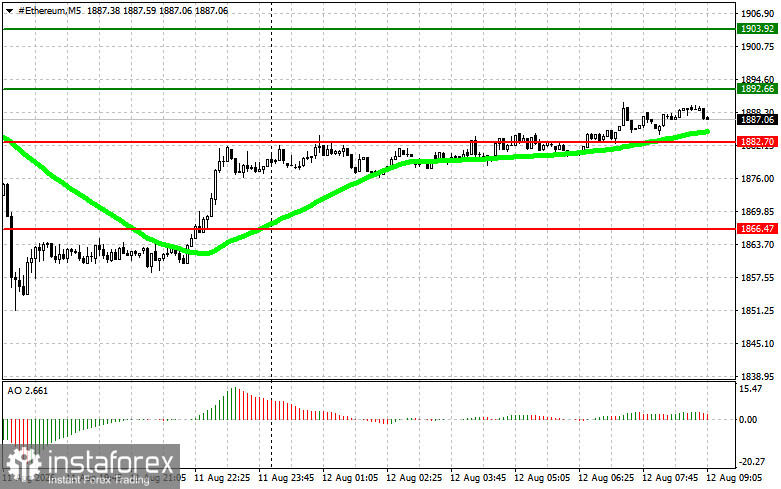
Scenario #1: I will buy Ether today if the entry point reaches around $1,892 with a target to rise to $1,903. Around $1,903, I will exit buy positions and sell immediately on the rebound. Before buying on a breakout, make sure the 50-day moving average is below the current price and the Awesome indicator is above zero.
Scenario #2: Ether can be bought from the lower boundary at $1,882 if there is no market reaction to its breakout to the downside, targeting $1,892 and $1,903.
Scenario #1: I will sell Ether today if the entry point reaches around $1,882, with a target to fall to $1,866. Around $1,866, I will exit sell positions and buy immediately on the rebound. Before selling on a breakout, make sure the 50-day moving average is above the current price and the Awesome indicator is below zero.
Scenario #2: Ether can be sold from the upper boundary at $1,892 if there is no market reaction to its breakout to the upside, targeting $1,882 and $1,866.
¡Los informes analíticos de InstaForex lo mantendrá bien informado de las tendencias del mercado! Al ser un cliente de InstaForex, se le proporciona una gran cantidad de servicios gratuitos para una operación eficiente.


