 Permanecer
Condiciones de negociación
Products
Herramientas



The GBP/USD currency pair continued its upward movement throughout Thursday and leaned towards growth again on Friday morning. Essentially, we had forecasted the rise of the British currency even before the unexpected and resonant decision by the US Treasury this week. However, this event only intensified the pressure on the US dollar and increased demand for riskier assets and currencies. Thus, we previously expected only growth from the British pound, and now we have even more reason to do so. On Thursday, there were no notable events or important reports in the UK and the US, but bullish sentiment in the market remains, for understandable reasons. We expect the British currency to rise at least to the 37 level, but likely, we are now looking at the resumption of the global upward trend that began back in 2022. If this is the case, then the pound will climb significantly above the psychological mark of 1.4000 by the end of the year. For a whole year, the British pound and the euro traded within sideways channels, but flat moves do not last forever. The dollar has no grounds for a downward trend, so only the resumption of the bullish trend remains. The end of the week will likely see restrained buying in the GBP/USD pair, given the clear trend at the moment. And within a trend, local reasons are not always necessary for movement to continue.
From a technical perspective, the British pound continues to form an upward trend on the hourly timeframe, as indicated by the trend line. In the long term, the pair is in a sideways channel and could resume the global upward trend of 2022. Thus, the pound can easily climb another 100 pips. Beyond that, everything will depend on whether the market is ready for the resumption of the global trend. We believe it is ready.
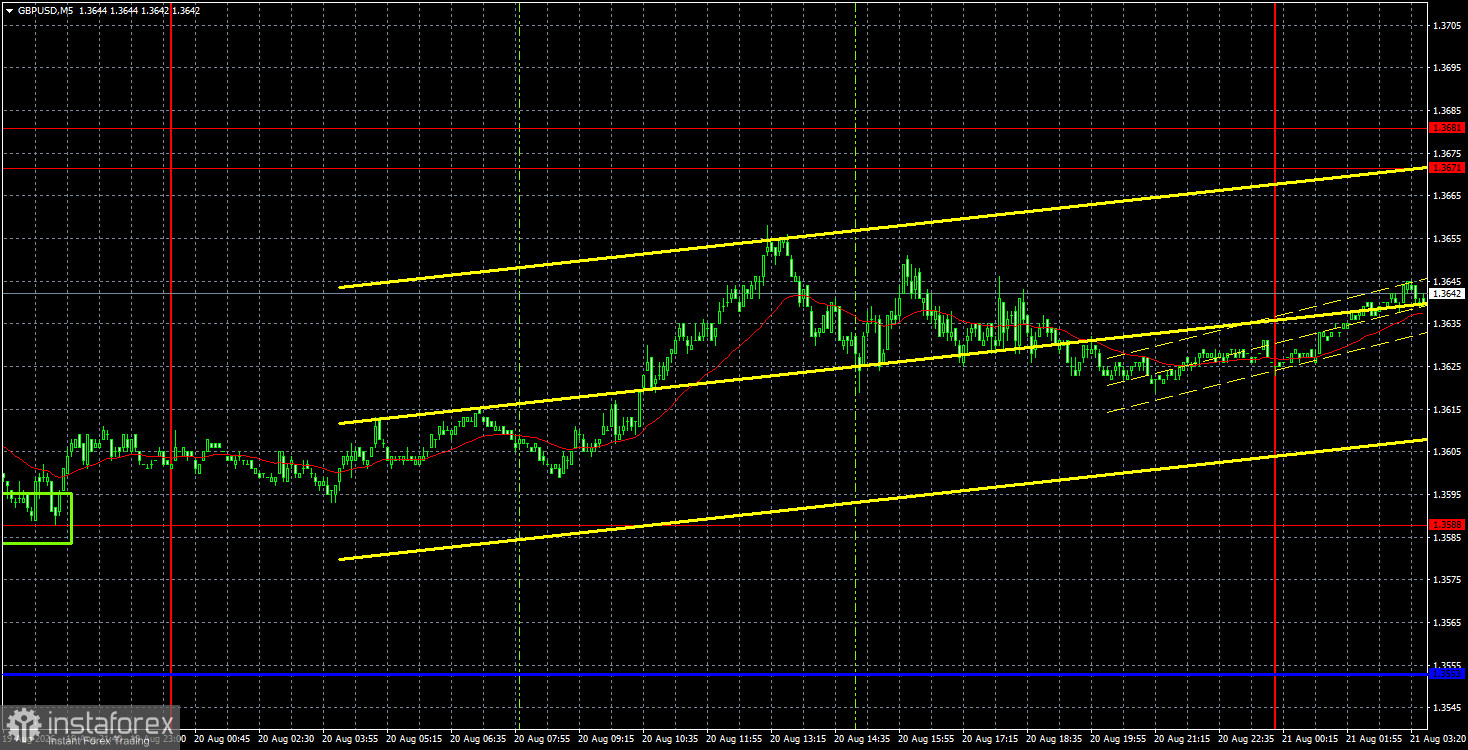
In the 5-minute timeframe, no trading signals were formed on Thursday; nevertheless, the pair continues to rise, and traders can remain in long positions based on buy signals formed Wednesday evening. The target remains the 1.3671-1.3681 area, which is now very close.
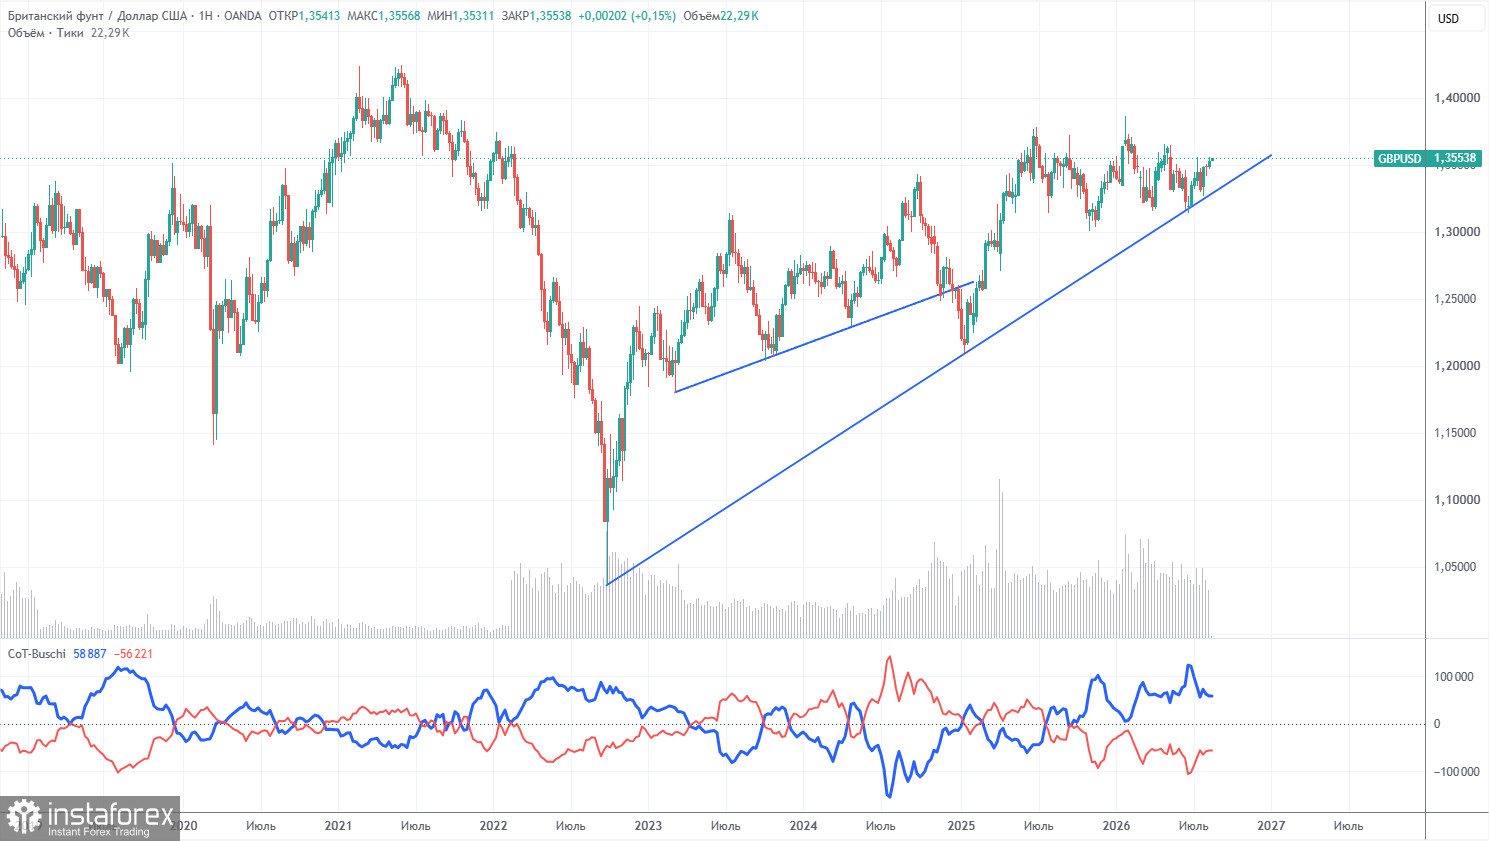
The COT reports for the British pound show that non-commercial traders have dominated the market, with sales for several consecutive months. The net position is negative despite an upward trend over the long term. Given the events in the Middle East, it is no surprise that demand for riskier currencies remains weak. While the war is formally over, the conflict persists. Geopolitics may continue to support demand for the US dollar in the near term. However, until a breach occurs below the trend line, we would not expect a significant downturn in the pair.
In the long term, the dollar will continue to decline due to Donald Trump's policies, which is clearly visible on the weekly timeframe. The trade war will continue in one form or another for a long time, and Trump's policies are aimed, directly and indirectly, at weakening the US currency. The long-term upward trend remains, as evidenced by the trend line. The price recently tested this line and rebounded from it. According to the latest COT report (dated August 11), the "Non-commercial" group opened 10,300 BUY contracts and 8,600 SELL contracts. Thus, the net position of non-commercial traders increased by 1,700 contracts over the week.
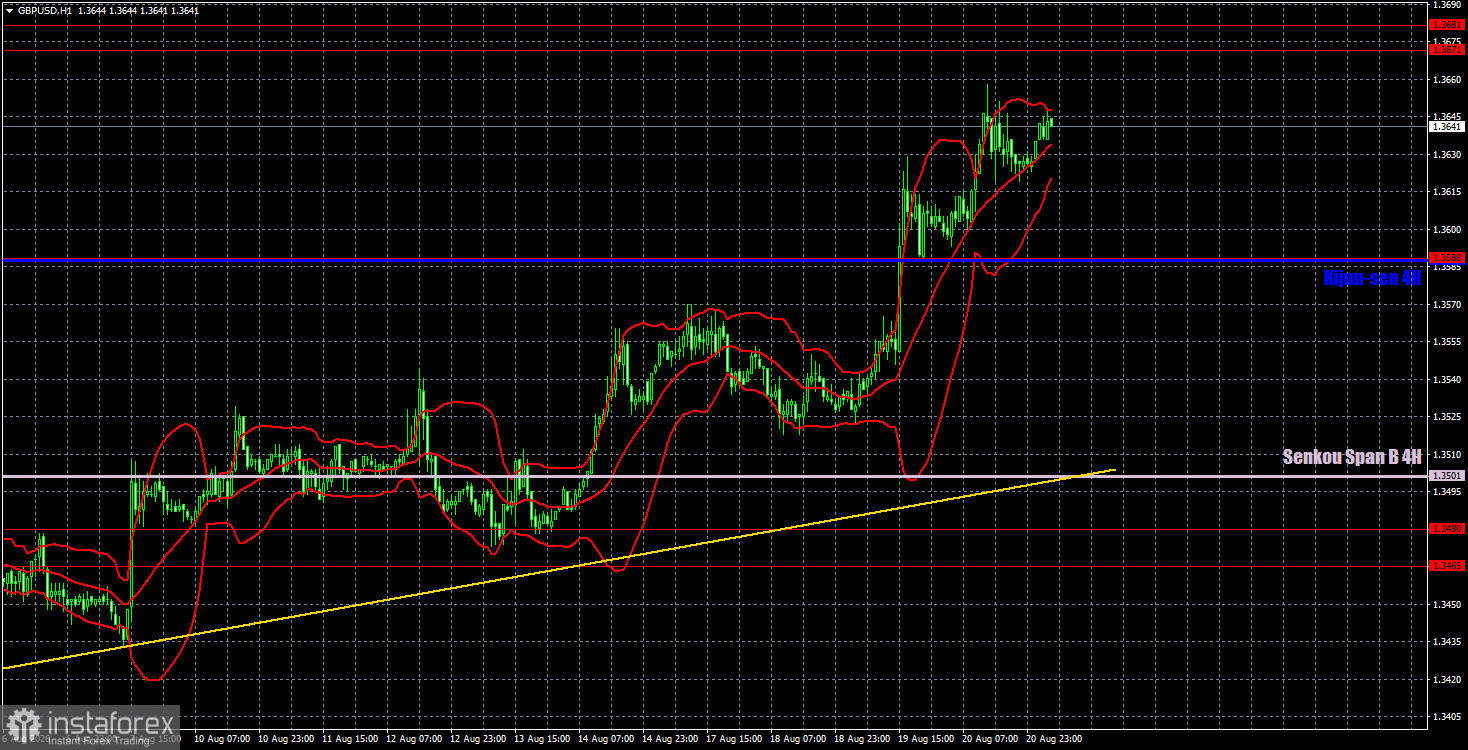
On the hourly timeframe, the GBP/USD pair continues to form an upward trend, as indicated by the trend line and the Ichimoku indicator lines. In the long term, both European currencies continue to "look" upward. We expect the British pound to continue its growth in the coming weeks. The upward trend will be interrupted if the price consolidates below the trend line.
For August 21, we highlight the following important levels: 1.3042-1.3050, 1.3096-1.3115, 1.3179-1.3187, 1.3301-1.3309, 1.3369-1.3377, 1.3465-1.3480, 1.3588, 1.3671-1.3681. The Senkou Span B (1.3501) and Kijun-sen (1.3588) lines can also serve as sources of signals. It is recommended to set a stop-loss at breakeven when the price moves in the right direction by 20 pips. Ichimoku indicator lines may shift throughout the day, which should be considered when determining trading signals.
On Friday, indices of business activity in the services and manufacturing sectors will be published in the UK and the US, and in the UK, there will also be a report on retail sales. We believe the British data could prompt a slight market reaction, but it is unlikely to affect overall bullish sentiment significantly.
Today, traders can open short positions with a target of 1.3588 if the price bounces from the 1.3671-1.3681 area. Long positions can be maintained after the level of 1.3588 is breached, targeting the area of 1.3671-1.3681.
¡Los informes analíticos de InstaForex lo mantendrá bien informado de las tendencias del mercado! Al ser un cliente de InstaForex, se le proporciona una gran cantidad de servicios gratuitos para una operación eficiente.


