 Permanecer

Condiciones de negociación
Products
Herramientas


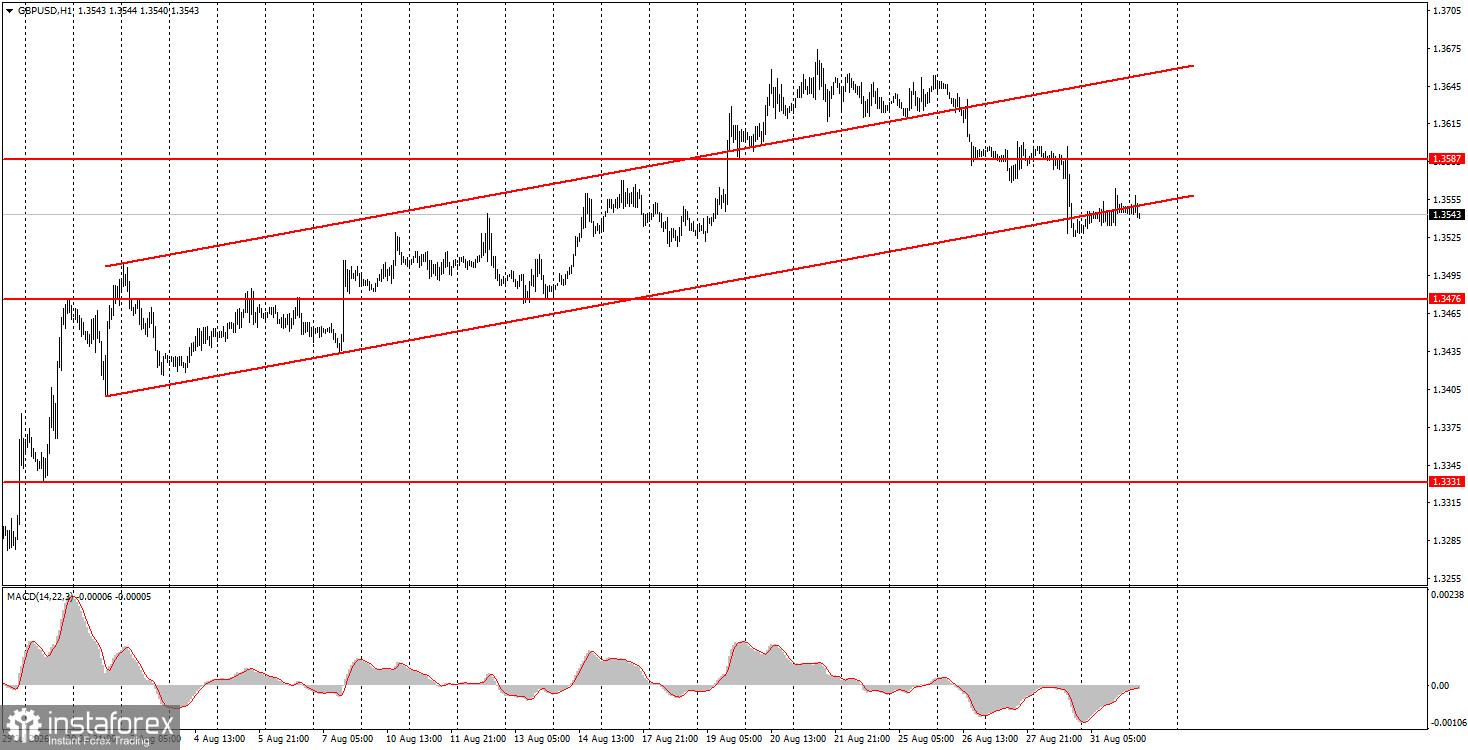
The GBP/USD pair did not show any significant movements on Monday. The day's volatility was less than 40 pips, with the price unable to demonstrate either an increase or a decrease. Overall, Monday was a continuation of Saturday and Sunday. There were no reports published in the UK or the US yesterday, so traders had nothing to react to throughout the day. Previously (on Friday), the price settled below the ascending channel. We cannot say it was a confident breakout and trend reversal, but the European currency more convincingly settled below the trend line, suggesting the trend may indeed have broken. Nonetheless, much will depend on this week's US macroeconomic data. Today, reports on business activity in the manufacturing sector and on the number of job openings will be published in the US. We consider the JOLTS report to be secondary, but if there is a significant deviation from forecasts, the market reaction may follow. Thus, the dollar will gain momentum only if the most important reports support it. The technical analysis on the hourly timeframe also favors the American currency in the near future.
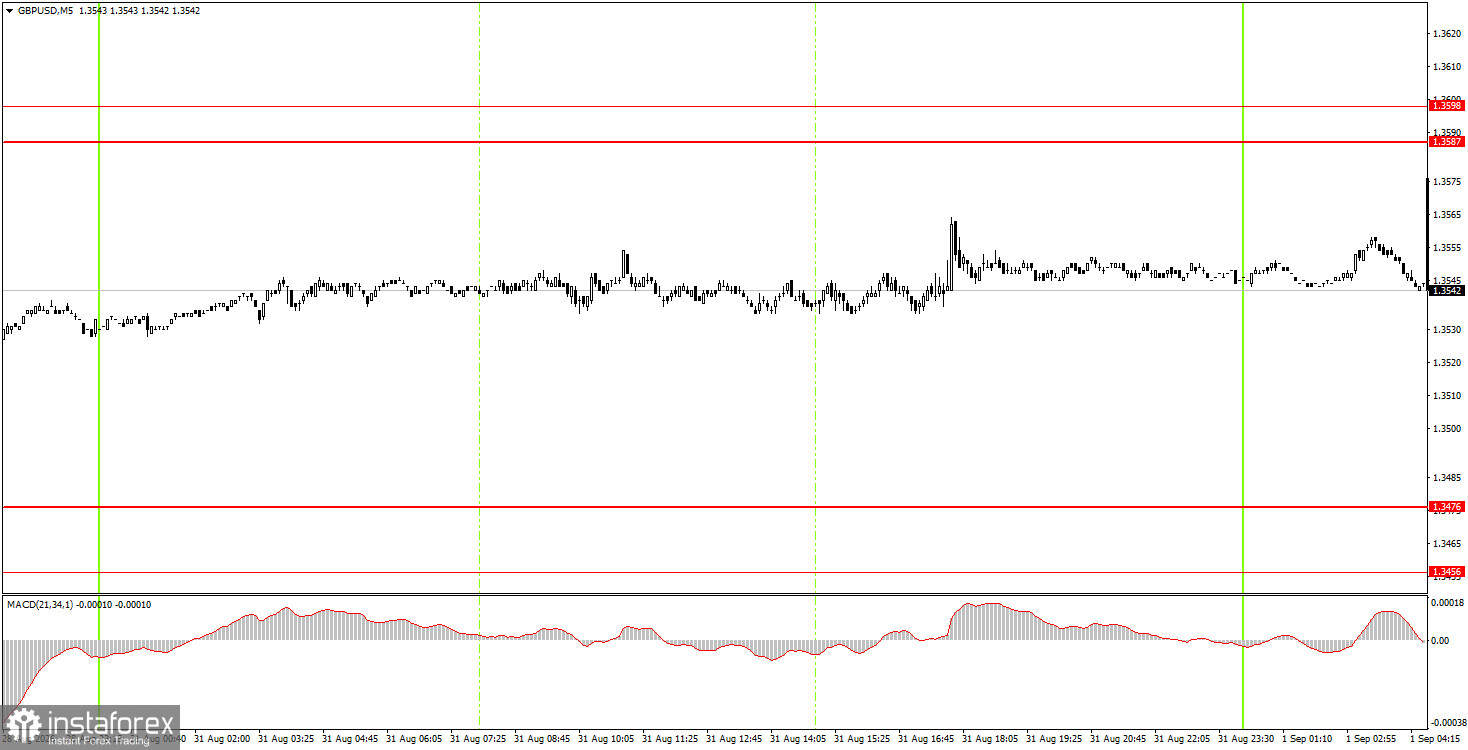
In the 5-minute timeframe, no trading signals were formed on Monday, as the price moved sideways with minimal volatility throughout the day. However, traders can still maintain the short positions opened on Friday.
On the hourly timeframe, the GBP/USD pair began a downward corrective trend. In our view, the British pound should continue to rise in the medium term, but it is currently in a correction. The movement from the lower boundary of the sideways channel to the upper boundary continues on the weekly timeframe, and it is not yet complete. Friday improved sentiment for the American currency, but this support is unlikely to last long for the dollar.
On Tuesday, novice traders may consider holding short positions targeting 1.3456-1.3476 following Friday's signal. Long positions can be opened with targets of 1.3587-1.3598 if the price rebounds from the 1.3456-1.3476 area or breaks through 1.3587-1.3598.
On the 5-minute timeframe, the following levels should be considered: 1.3259-1.3267, 1.3319-1.3331, 1.3380-1.3386, 1.3456-1.3476, 1.3587-1.3598, 1.3631-1.3641, 1.3695, 1.3741. On Tuesday, no significant events are scheduled in the UK, while the JOLTS and ISM reports will be released in the US. We believe the market may respond to these two reports.
Price levels (areas) of support and resistance are levels that serve as targets when opening buy or sell trades, or as sources of signals.
Red lines indicate channels or trend lines that illustrate the current trend and show the preferred direction for trading.
The MACD indicator (14,22,3) — the histogram and signal line — is an auxiliary indicator that can also be used as a source of signals.
Important speeches and reports (contained in the news calendar) can significantly influence the movement of currency pairs. Therefore, during their release, trading should be approached with utmost caution, or traders should exit the market to avoid sudden reversals against the preceding movement.
Beginner forex traders should remember that not every trade can be profitable. Developing a clear strategy and practicing money management are key to long-term success in trading.
¡Los informes analíticos de InstaForex lo mantendrá bien informado de las tendencias del mercado! Al ser un cliente de InstaForex, se le proporciona una gran cantidad de servicios gratuitos para una operación eficiente.


