 Permanecer

Condiciones de negociación
Products
Herramientas


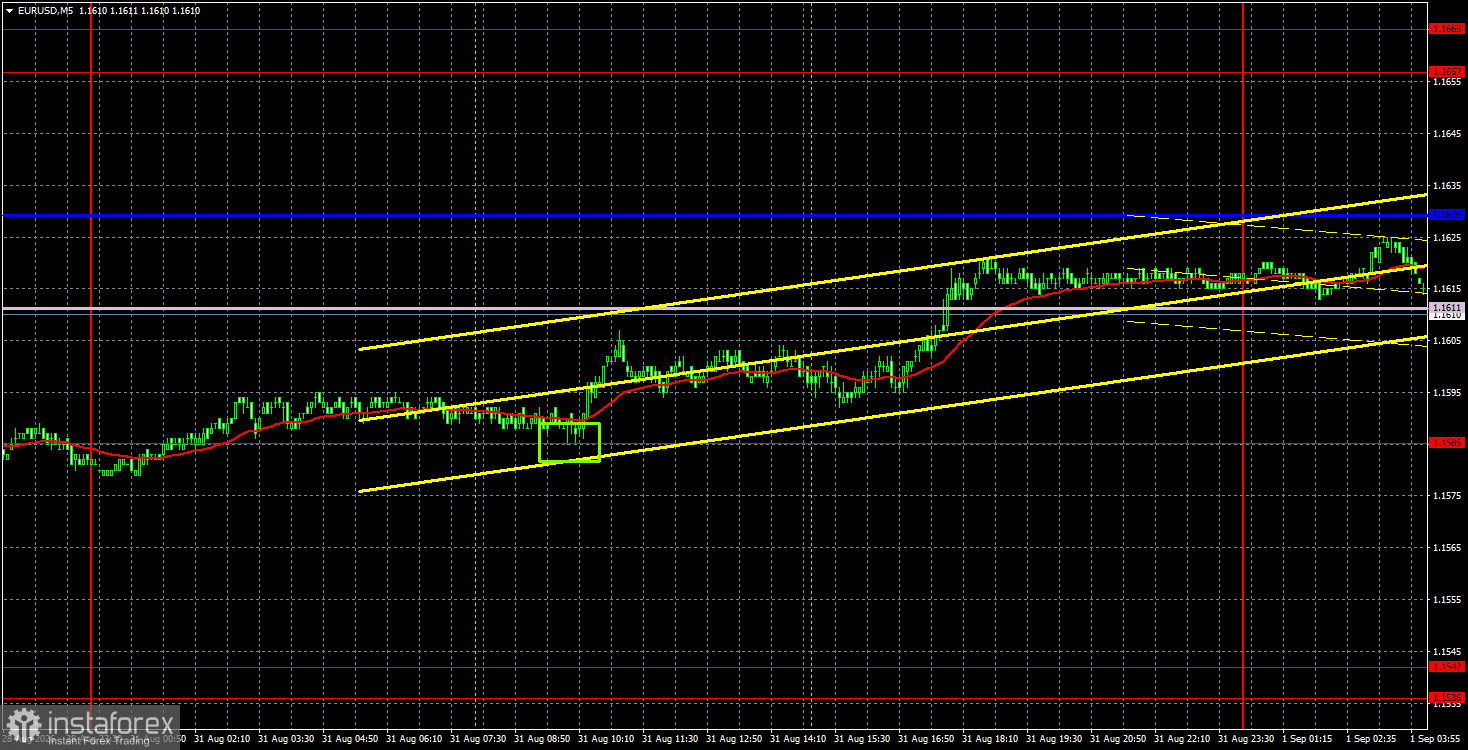
The EUR/USD currency pair slightly rebounded on Monday, suggesting a correction against the previous downward trend rather than a new downward movement. The only event of the day was the publication of Germany's inflation report. The consumer price index increased in August to 2.9%, against forecasts of 3.0%. Thus, inflation rose, but at a slower pace than expected. Traders will not base their conclusions solely on this report but rather on the overall inflation data for the Eurozone, which will be published today. If inflation accelerates to forecasted levels or higher, it will provide substantial grounds to anticipate the European Central Bank's monetary policy tightening as early as September.
It's worth reminding that the ECB is not constrained in its actions. If inflation continues to rise, the ECB will comfortably raise rates for the second time. In the U.S., the labor market is now a restraining factor, having declined for four consecutive months and likely to show another unsatisfactory number on Friday. Additionally, annual Nonfarm Payrolls have been revised downward, leading to skepticism about Warsh's team being ready to vote to tighten policy in September.
From a technical perspective, the pair has initiated a new downward trend after breaching the ascending trend line, as well as the Senkou Span B and Kijun-sen lines, which is clearly visible on the hourly timeframe. Therefore, the pair may continue to decline in the near future. A significant amount of important data will be published in both the U.S. and the Eurozone this week, so the pair may frequently change direction.
On the 5-minute timeframe, a relatively weak buy signal was formed on Monday. During the European trading session, the price rebounded from 1.1585, allowing it to advance toward the Senkou Span B and Kijun-sen lines. Thus, traders could earn a few dozen pips even in Monday's low-volatility environment.
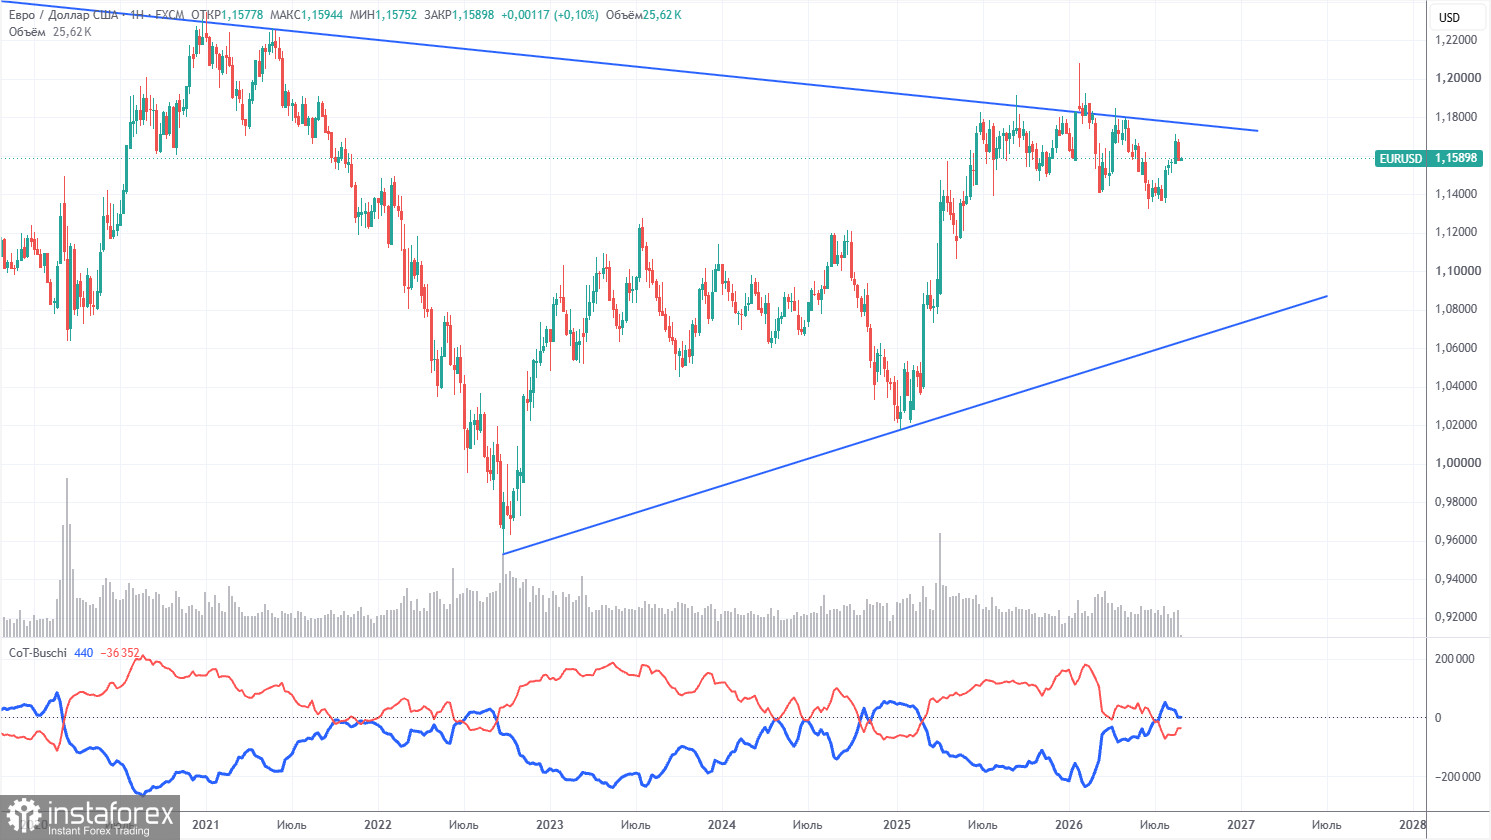
The latest COT report is dated August 25. In the weekly timeframe illustration, it is clear that the net position of non-commercial traders has turned "bearish" and has significantly decreased in 2026 due to geopolitical events. Traders have been getting rid of the European currency in favor of the U.S. dollar in recent months. Donald Trump's policy remains unchanged, but the dollar once served as a "reserve currency."
We still do not see any fundamental factors that would strengthen the American currency. The war in the Middle East made the dollar temporarily very attractive, but once this factor reaches its "expiration date," everything will return to normal. This process may have already concluded. In the long term, the euro may fall as low as the 1.08$ level (trend line), but the upward trend will remain valid. Over the last months of dollar growth, the pair has not approached this line significantly.
The positions of the red and blue lines of the indicator suggest an approximate parity between bulls and bears. Over the last reporting week, the number of longs in the "Non-commercial" group increased by 2,700, while the number of shorts decreased by 20,000. Consequently, the net position grew by 22,700 contracts during the week.
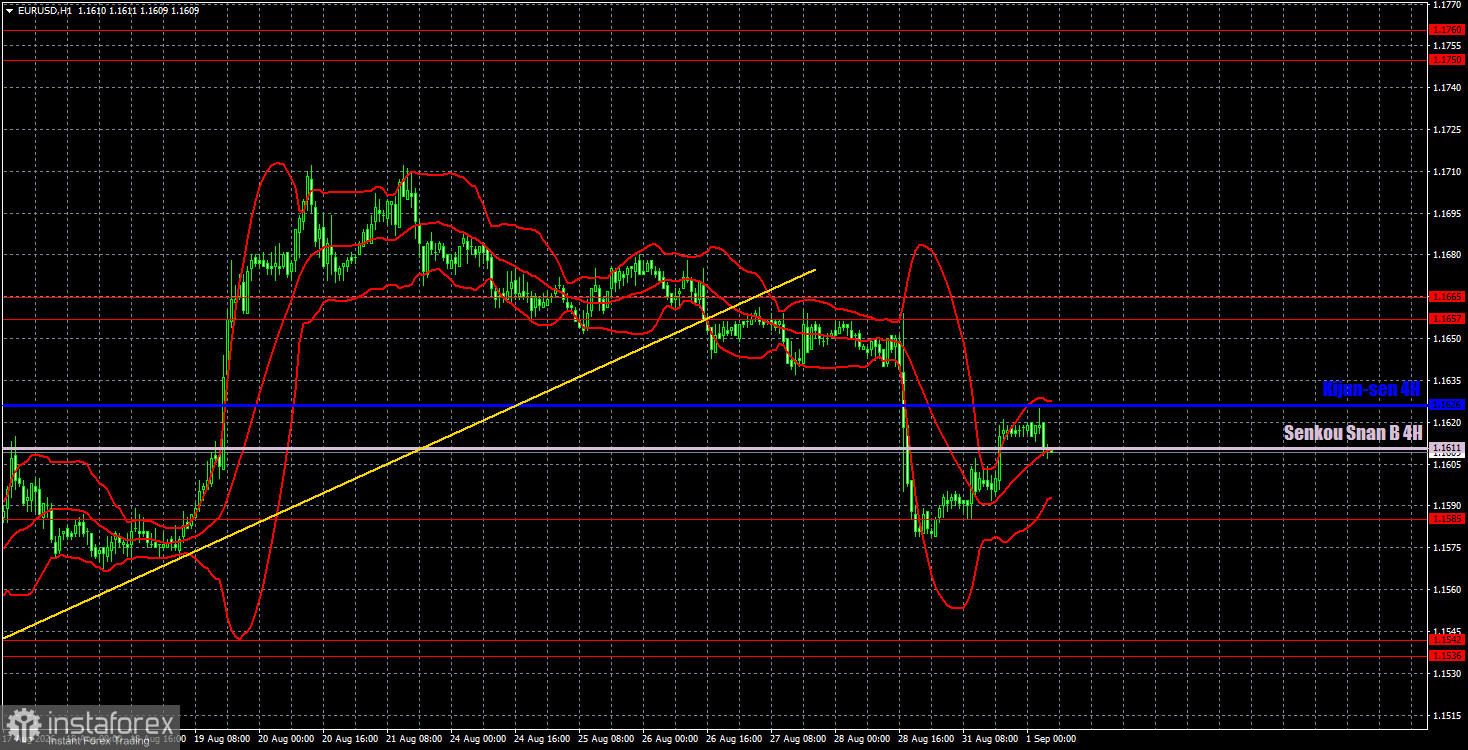
On the hourly timeframe, the pair interrupted its upward trend on Friday. The situation in the Middle East remains tense and has not improved, but this is not enough for a new, strong rise in the dollar. Kevin Warsh's speech and the annual Nonfarm Payrolls supported the dollar, but we do not see any significant reasons for optimism or excellent prospects for the American currency. This week, U.S. data could halt the dollar's rise.
For September 1, we highlight the following levels for trading — 1.1234, 1.1274, 1.1362-1.1368, 1.1461-1.1473, 1.1536-1.1542, 1.1585, 1.1657-1.1665, 1.1750-1.1760, 1.1786, 1.1830-1.1837, as well as the Senkou Span B line (1.1611) and Kijun-sen (1.1626). The lines of the Ichimoku indicator may move throughout the day, which should be taken into account when determining trading signals. Don't forget to set a stop-loss order to break even if the price moves 15 pips in the right direction. This will protect against potential losses if the signal proves false.
On Tuesday, a significant inflation report for the Eurozone will be released, which could influence the ECB's decision on rates in September. In the U.S., important reports on job openings and business activity in the manufacturing sector will also be published. The market may react to this data in the second half of the day.
Today, traders may consider short positions targeting 1.1536-1.1542 if price rebounds from the 1.1611-1.1626 area. A consolidation above the Ichimoku indicator lines will allow opening long positions targeting 1.1657-1.1665 and above.
Price levels (areas) of support and resistance are thick red lines where movement may conclude. They are not sources of trading signals.
The Kijun-sen and Senkou Span B lines are Ichimoku indicator lines transferred to the hourly timeframe from the 4-hour timeframe. They are strong lines.
Extreme levels are thin red lines from which the price has previously rebounded. They are sources of trading signals.
Yellow lines indicate trend lines, trending channels, and any other technical patterns.
Indicator 1 on COT charts shows the size of the net position of each category of traders.
¡Los informes analíticos de InstaForex lo mantendrá bien informado de las tendencias del mercado! Al ser un cliente de InstaForex, se le proporciona una gran cantidad de servicios gratuitos para una operación eficiente.


